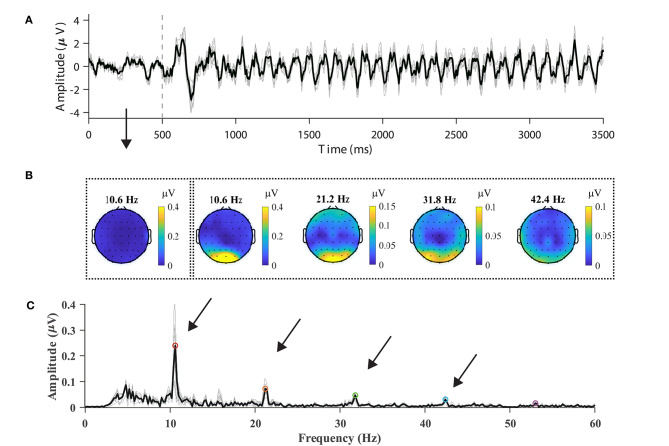
Figure 2.
Typical SSVEP features in the temporal, spectral, and spatial domains. (A) Time course of average 10.6-Hz SSVEP of nine parietal and occipital channels (Pz, PO3, PO5, PO4, PO6, POz, O1, Oz, and O2). The dash line represents stimulus onset. (B) The topographic maps of SSVEP amplitudes at frequencies in the range from the fundamental signal (10.6 Hz) to the fourth harmonic (21.2, 31.8, and 42.4 Hz). The leftmost scalp map indicates the spectral amplitude at the fundamental frequency before stimulus. (C) The amplitude spectrum of the SSVEP of the nine channels at 10.6 Hz. Up to five harmonics are visible in the amplitude spectrum. The averaged spectrum across channels is represented in the dark line in (A,C).

