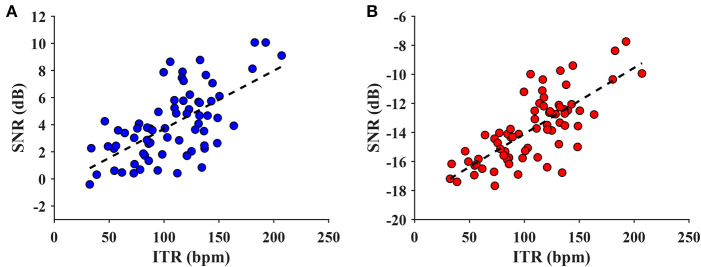
Figure 9.
The scatter plot of narrow-band SNR vs. ITR (A) and wide-band SNR vs. ITR value (B). The dash line indicates a linear model regressed on the data (A: adjusted R2 = 0.393, p < 0.001; B: adjusted R2 = 0.549, p < 0.001). The regression indicates that the wide-band SNR correlated better with the ITR than the narrow-band SNR.

