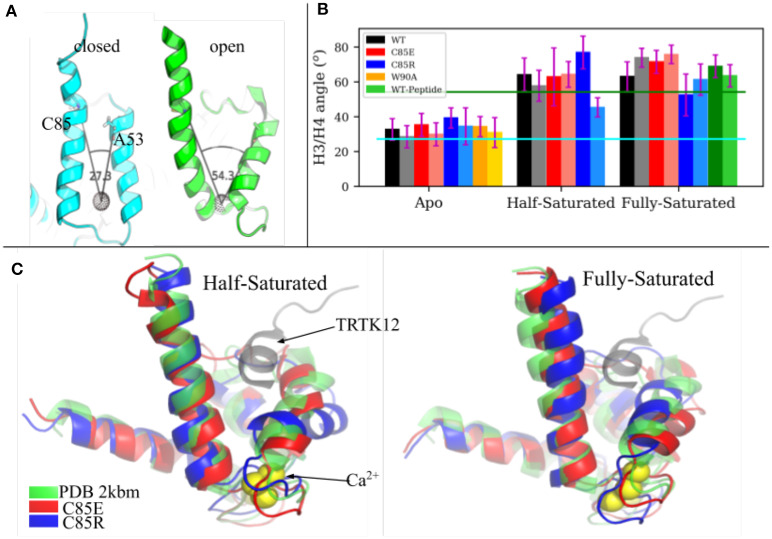
Figure 3.
(A) H3/H4 inter-helix angle of S100A1 in closed state (PDB 2L0P) and open state (PDB 2LP3). The angle is defined between Cα atoms of C85/A53 and the COM of residues L61 to D62 and Q72 to E73 (shown as a black dotted sphere). (B) Average H3/H4 angle derived from MD simulations. Chain A and chain B are represented by deep and light shaded bars, respectively. The error bars are standard deviations. (C) Superimpose of MD-sampled half-saturated and fully-saturated S100A1 mutants with the NMR structure of TRTK12 bound S100A1 (PDB 2KBM). Ca2+ ions are represented as yellow spheres.

