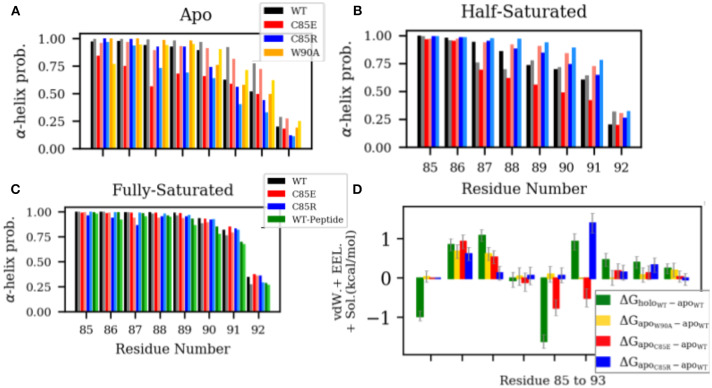
Figure 4.
(A–C) α-helix probability of H4 residues C85 to S93. Chain A and chain B are represented by dark and light shaded bars, respectively. (D) Difference of per residue energy contribution to the MMGBSA-calculated interaction energy between the two monomers of S100A1. The error bars represent standard deviations.

