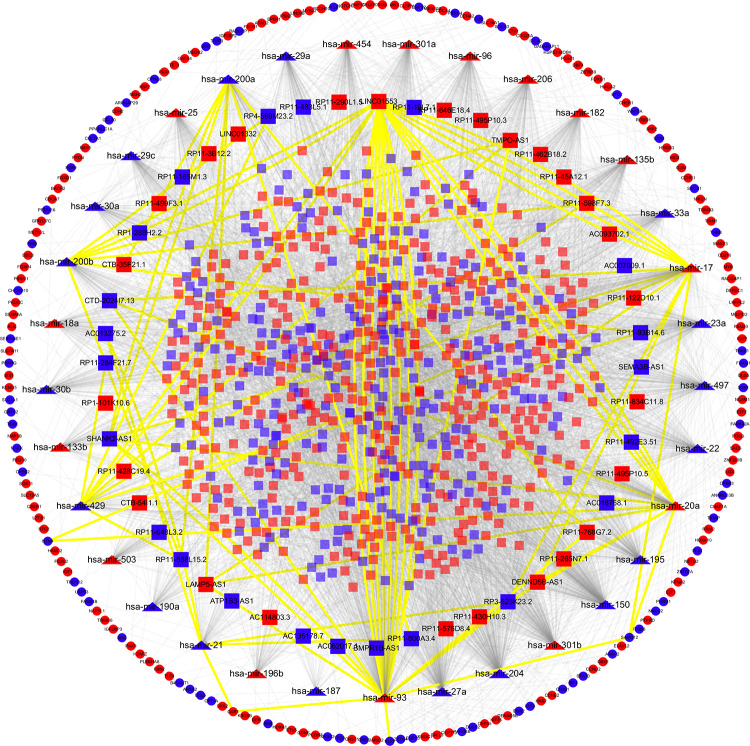
Figure 2.
The lncRNA–miRNA–mRNA ceRNA regulatory network in Wilms tumor. LncRNAs, miRNAs, and mRNAs are denoted by rectangle, triangle, and ellipse, respectively. The nodes colored in red and blue, respectively, refer to upregulated and downregulated RNAs. The 62 lncRNAs–miRNAs interactions and 8 miRNAs–mRNAs interactions involved in RNAs with potential prognostic value were highlighted by yellow color. ceRNA indicates competing endogenous RNA; lncRNAs, long noncoding RNAs; mRNAs, messenger RNA; miRNAs, microRNAs.

