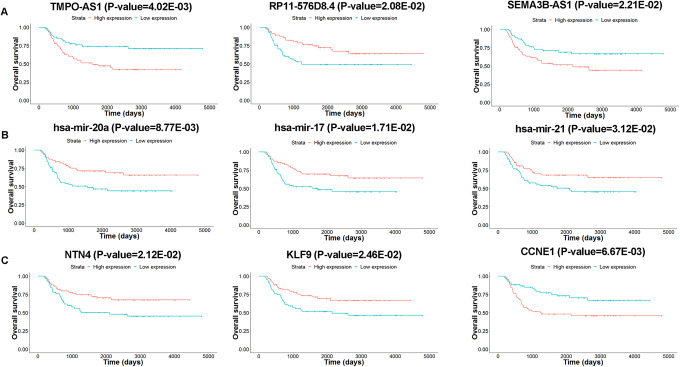
Figure 4.
The Kaplan-Meier curves for RNAs associated with overall survival in Wilms tumor. A, lncRNAs for TMPO-AS1, RP11-576D8.4, and SEMA3B-AS1. B, miRNAs for hsa-mir-20a, hsa-mir-17, and hsa-mir-21. C, mRNAs for NTN4, KLF9, and CCNE1. Horizontal axis represents overall survival time (days) and vertical axis shows survival probability. lncRNAs indicates long noncoding RNAs; mRNAs, messenger RNA; miRNAs, microRNAs.

