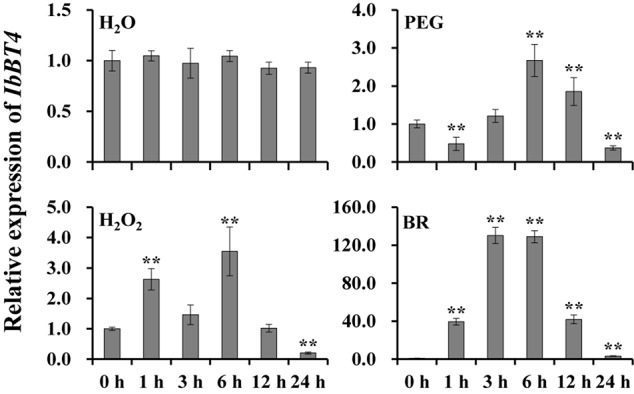
FIGURE 3.

Expression analysis of IbBT4 in in vitro-grown Xushu55-2 plants after different time points (h) in response to H2O (control), 30% PEG6000, 100 μM H2O2 and 100 nM BR, respectively. The data are presented as the means ± SEs (n = 3). **Indicates a significant difference at P < 0.01 according to Student’s t-test.
