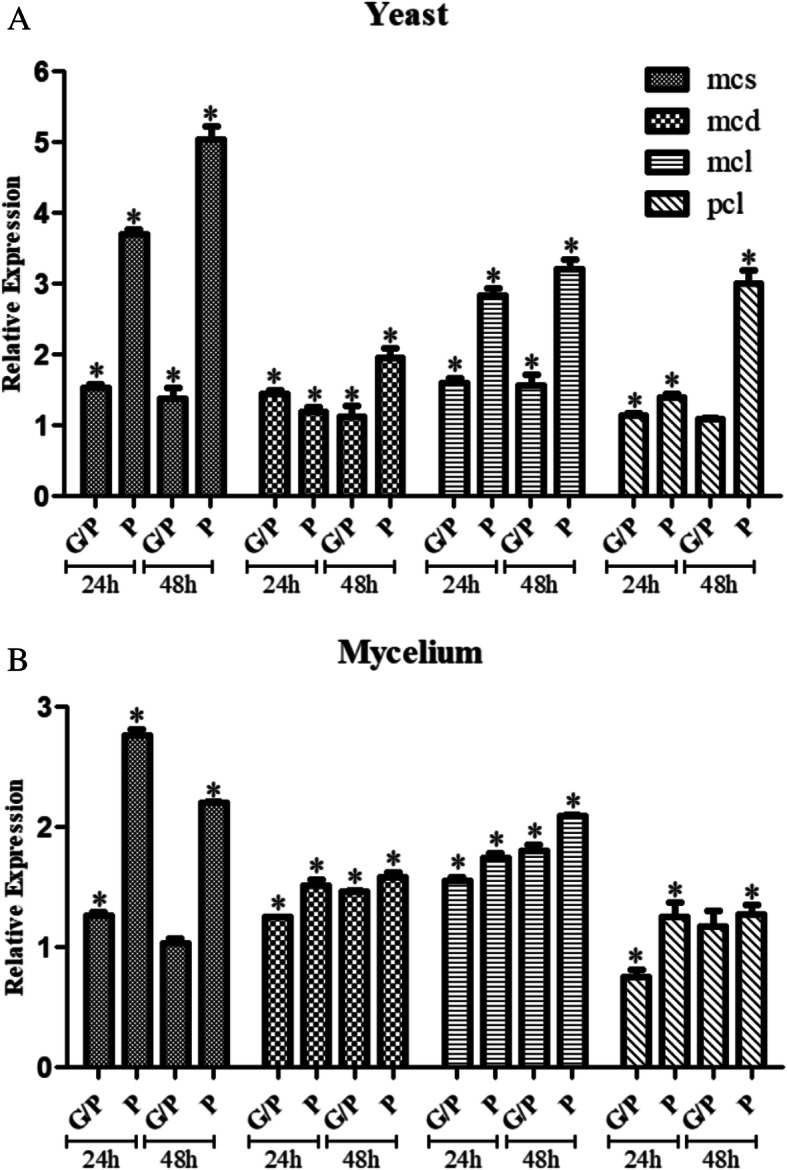
Fig. 4.

Expression analysis of the genes related to propionate metabolism on different carbon sources. Expression levels of the mcs, mcd, mcl and pcl genes from mycelium (b) and yeast (a) cells of P. lutzii grown in propionate (P) and glucose plus propionate (GP). The gene expression levels of propionate and glucose plus propionate were normalized to glucose condition (control carbon source). Error bars represent the standard deviation from the average obtained from triplicates; * p < 0.05
