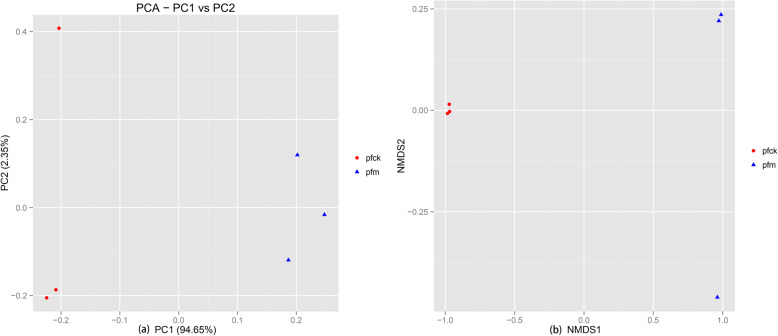
Fig. 3.
Beta diversity comparison of bacterial genes in intestinal contents between pfck and pfm. a Principal Component Analysis (PCA); the dominant bacterial communities of the gut microbiota in the 2 groups; the weights of PC1 and PC2 are 0.97, and amount of information contained is sufficient to illustrate the overall sample situation; b Analytical diagram of NMDS; each point in the figure represents a sample; the points with the same color belong to the same group; the closer the distance between the two points, the smaller the difference of microbial communities between the two samples

