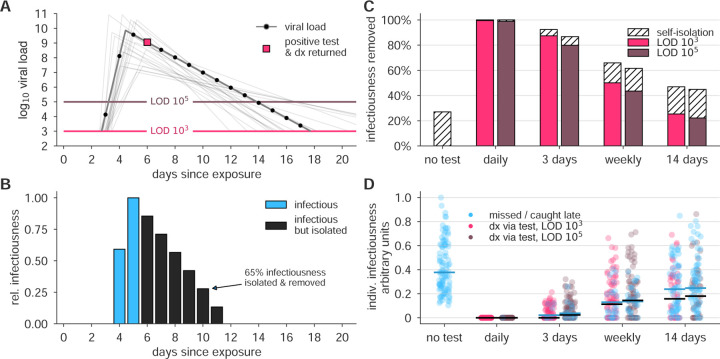
Figure 1: Surveillance testing effectiveness depends on frequency.
(A) An example viral load trajectory is shown with LOD thresholds of two tests, and a hypothetical positive test on day 6, two days after peak viral load. 20 other stochastically generated viral loads are shown to highlight trajectory diversity (light grey; see Methods). (B) Relative infectiousness for the viral load shown in panel A pre-test, totaling 35% (blue) and post-isolation, totaling 65% (black). (C) Surveillance programs using tests at LODs of 103 and 105 at frequencies indicated were applied to 10, 000 individuals’ trajectories of whom 35% would undergo symptomatic isolation near their peak viral load if they had not been tested and isolated first. Total infectiousness removed during surveillance (colors) and self isolation (hatch) are shown for surveillance as indicated, relative to total infectiousness with no surveillance or self-isolation. (D) The impact of surveillance on the infectiousness of 100 individuals is shown for each surveillance program and no testing, as indicated, with each individual colored by test if their infection was detected during infectiousness (medians, black lines) or colored blue if their infection was missed by surveillance or detected positive after their infectious period (medians, blue lines). Units are arbitrary and scaled to the maximum infectiousness of sampled individuals.

