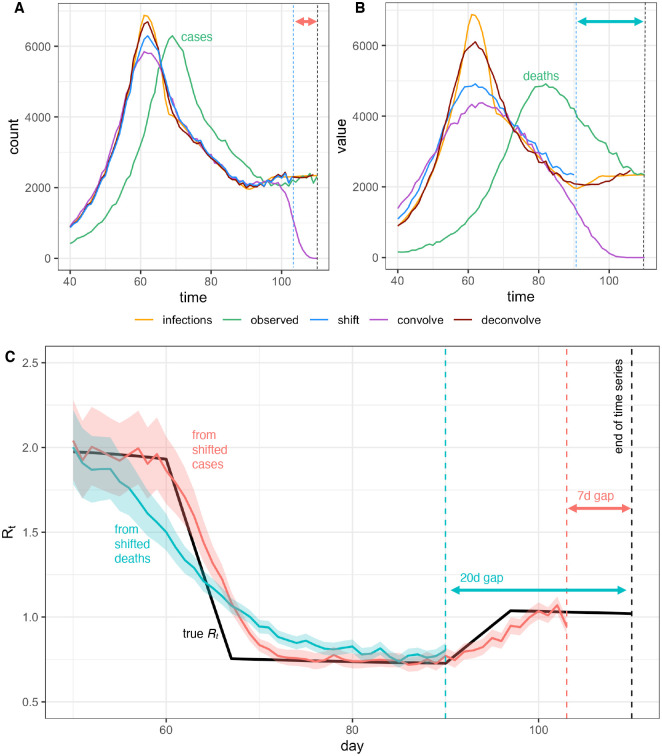
Fig 5. Pitfalls of simple methods to adjust for delays to observation when estimating Rt.
Infections back calculated from (A) observed cases or (B) observed deaths either by shifting the observed curve back in time by the mean observation delay (shift), by subtracting a random sample from the delay distribution from each individual time of observation (convolve), or by deconvolution (deconvolve), without adjustment for right truncation. Neither back-calculation strategy accurately recovers peaks or valleys in the true infection curve. The inferred infection curve is less accurate when the variance of the delay distribution is greater (B vs. A). (C) Posterior mean and credible interval of Rt estimates from the Cori et al. method. Inaccuracies in the inferred incidence curves affect Rt estimates, especially when Rt is changing (here Rt was estimated using shifted values from A and B). Finally we note that shifting the observed curves back in time without adjustment for right truncation leads to a gap between the last date in the inferred time series of infection and the last date in the observed data, as shown by the dashed lines and horizontal arrows in A-C.

