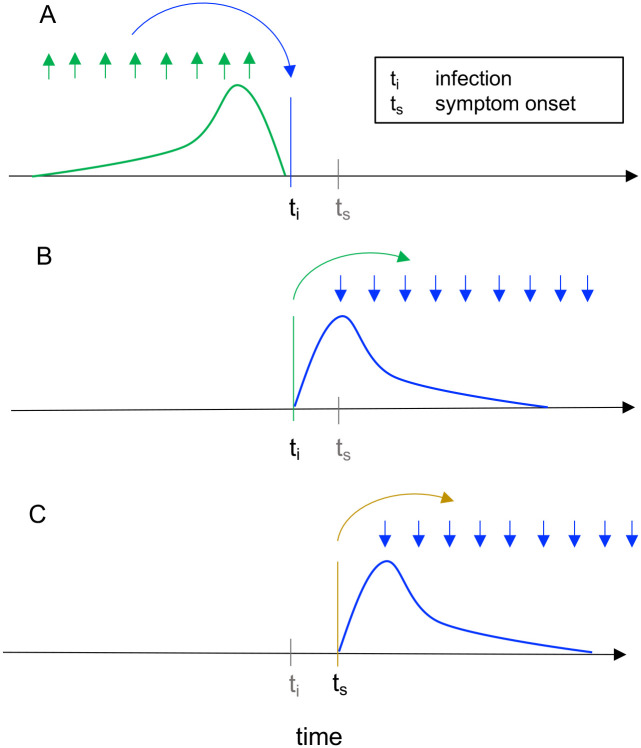
Fig 1. Instantaneous reproductive number as estimated by the method of Cori et al. versus cohort reproductive number estimated by Wallinga and Teunis.
For each definition of Rt, arrows show the times at which infectors (upwards), and their infectees (downwards) appear in the data. Curves show the generation interval distribution (A,B), or serial interval distribution (C). A: The instantaneous reproductive number quantifies the number of new infections incident at a single point in time (ti, blue arrow), relative to the number of infections incident in the previous generation (green arrows), and their current infectiousness (green curve). This figure illustrates the method of Cori et al. B & C: The case reproductive number of Wallinga and Teunis is the average number of new infections that an individual who becomes (B) infected on day ti (green arrow) or (C) symptomatic on day ts (yellow arrow) will eventually go on to cause (blue downward arrows show timing of daughter cases). The first definition applies when estimating the case reproductive number using inferred times of infection, and the second applies when using data on times of symptom onset.

