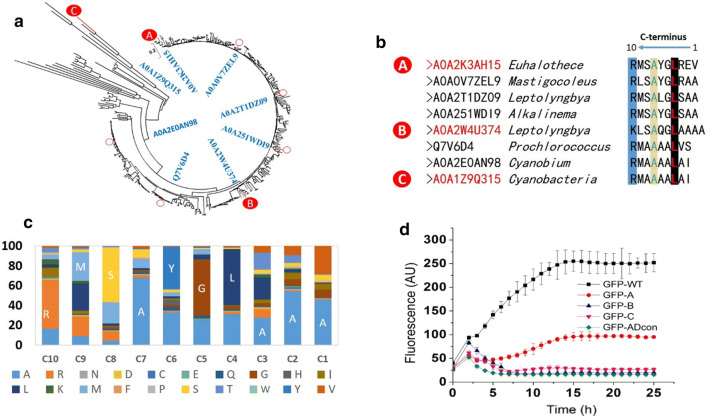
Fig. 4.
Analysis of C-terminal sequences of AD homologs in bacteria. a Phylogenetic reconstruction of AD sequences. The phylogenetic tree was generated using MEGA 5.10’s NJ method with 100 bootstrap replications. b Multiple sequence alignment of the C-terminal regions of eight AD sequences, with three representatives (labeled a, b, c) used for subsequent investigation. c Statistical analysis of C-terminal sequence of 371 AD homologs. d GFP degradation test of three representative C-terminal peptides and the conserved degron sequence. GFP-A, GFP-B, GFP-C represent GFP fused with three C-terminal regions from (b). GFP-ADcon represents GFP fused with conserved sequence from (c). Fluorescence values were normalized to the number of cells by dividing by the OD600. The data shown are from the mean of three biological replicates

