
FIGURE 1.
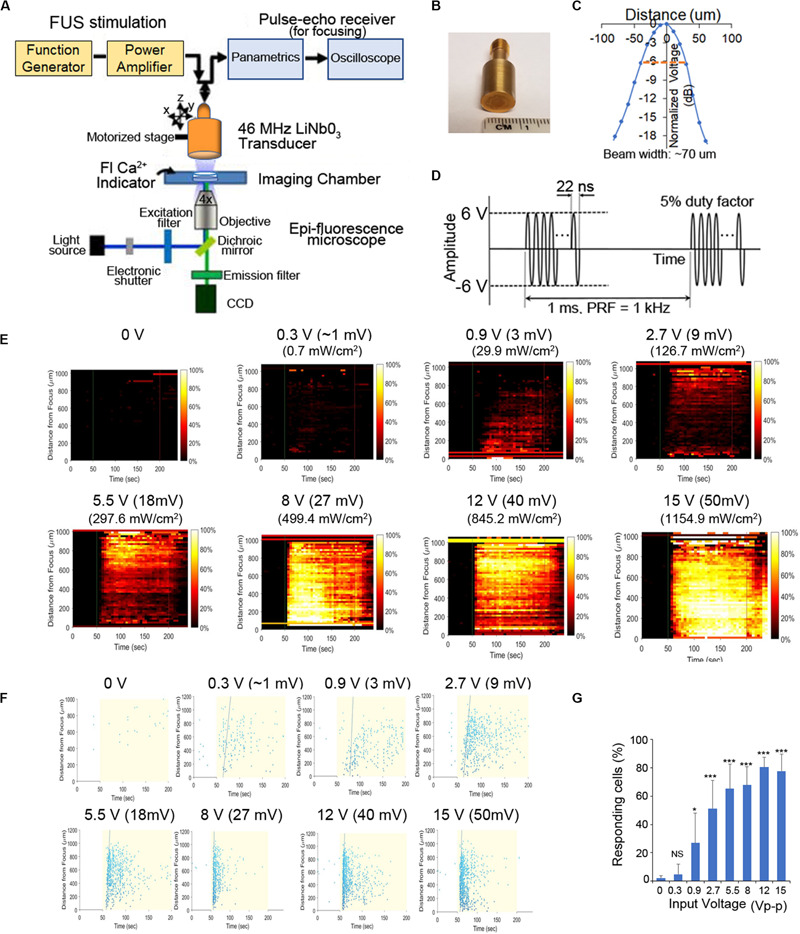
Schematic of our experimental system and effect of FUS stimulation amplitude on PC-3 Ca2+ response. (A) A 46-MHz, single-element, LiNbO3, press-focused transducer was used for FUS stimulation and focused with a pulse-echo receiver. Cells were imaged using epi-florescence microscopy in the presence of a Ca2+ indicator. (B) Photograph of the 46-MHz transducer used in most experiments. (C) The beam width produced by the transducer was measured by hydrophone and was ∼70 μm. (D) Typical voltage waveform used to drive the transducer. Carrier frequency had an amplitude of 46 MHz (12 Vp–p), pulse repetition frequency was 1 kHz and duty cycle was 5%. (E,F) Effect of FUS stimulation amplitude on PC-3 Ca2+ response. Standard stimulus parameters (D) were used while varying the transducer input voltage. All stated voltages represent peak-to-peak amplitude (Vp-p). Values in parentheses indicate the mV and Ispta at each voltage, as measured by a hydrophone. (E) 2-D histograms showing the percentage of responding cells over time. (F) Scatter plots showing the time at which each individual cell first responds. (G) Quantitative percentage of responding cells. n > 3 biological replicates. Error bars, SEM., *P < 0.05; **P < 0.01; ***P < 0.001 by a one-tailed t-test. n represents biological replicates.