
FIGURE 2.
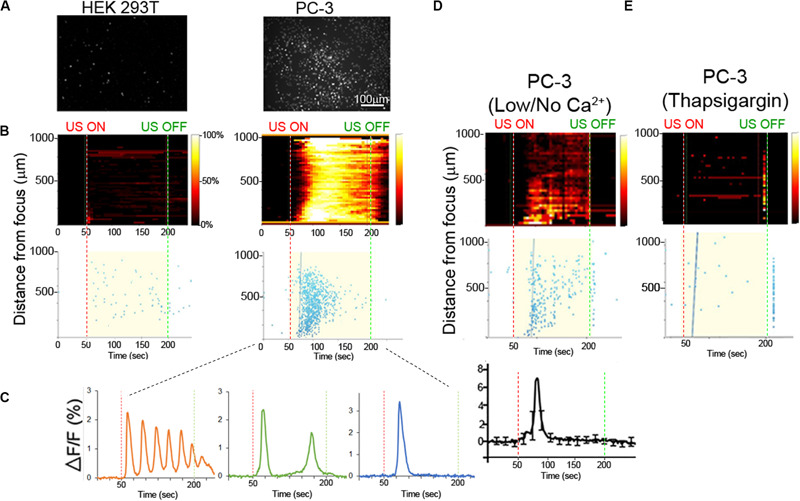
Ca2+ dynamics in invasive and non-invasive FUS stimulated cancer cells. (A) Background-subtracted fluorescence images show strong Ca2+ signaling in invasive PC-3 (right) but not non-invasive HEK (left) cells. (B) Top, 2-D histograms showing the percentage of responding cells over time. Vertical red and green dotted lines indicate FUS stimulus onset (50 s) and offset (200 s) times, respectively. Bottom, scatter plots showing the time of the first response in individual cells following stimulus. (C) Typical Ca2+ responses in invasive PC-3 cells exhibit either an oscillating (left), double (center) or single (right) spike pattern. (D) Ca2+ responses are present in PC-3 cells in external no or 20 μM (low) Ca2+ concentration. (E) Thapsigargin (TG) treatment in the normal external Ca2+ concentration (2 mM) drastically reduces the Ca2+ response.