
FIGURE 3.
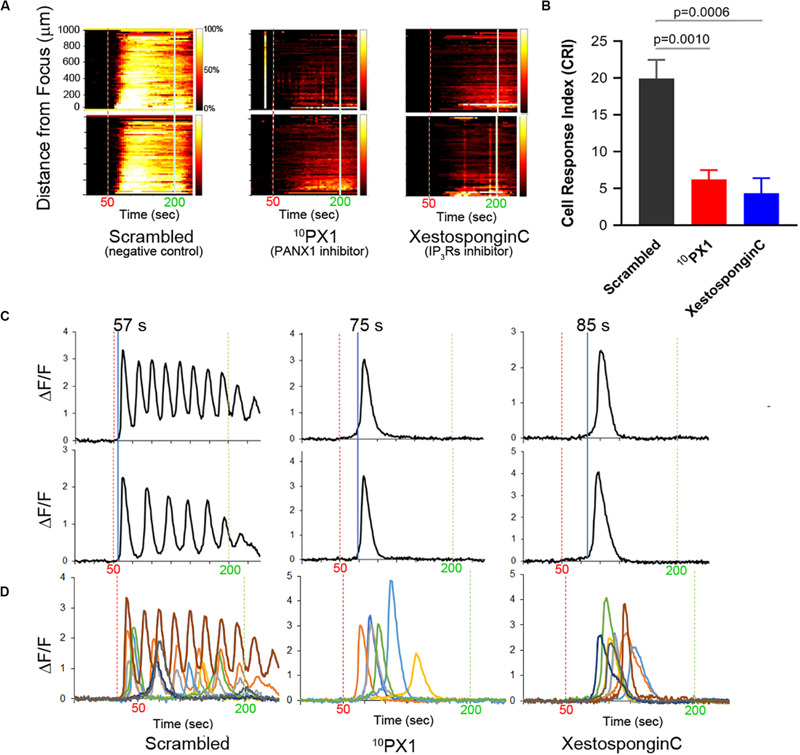
Treatment of PC-3 cells with 10PX1 (PANX1 inhibitor) abolishes the normal FUS-induced Ca2+ oscillation response but uncovers single Ca2+ transients. (A) Left column, the cells exhibited strong Ca2+ responses at 20 min after 200 μM scrambled peptide application as a control. Center column, cells were stimulated at 20 min after 200 μM 10Panx1 peptide (10PX1) application, and the responses were partly reduced. Right column, 20 min after 2 μM Xestospongin C (XC) application, the responses were also partly reduced. Two representative cells were shown in each treatment. (B) Quantitative CRI values of the inhibitor treatments. n = 3 (XC), or n = 6 (SC, 10PX1). Error bars, s.e.m., ANOVA, Dunnet’s correction, exact p-values. (C) Fluorescence patterns in cells that first responded to the stimulus after the treatments. Two representative cells are shown by ΔF/F. (D) Fluorescence patterns in several cells that first responded to the stimulus after the treatments; Scrambled (9 cells), 10PX1 (5 cells) and XC (6 cells).