
FIGURE 4.
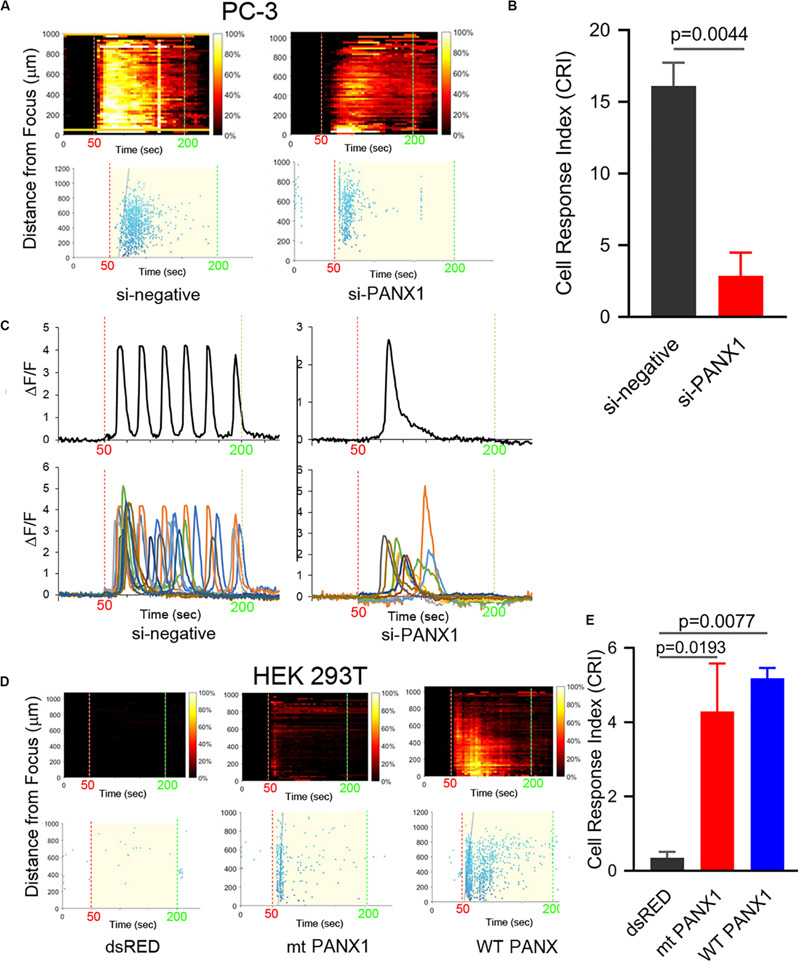
PANX1 expression appears to be both necessary and sufficient for intracellular Ca2+ responses. (A) si-PANX1 RNA treatment in PC3 cells reduced Ca2+ responses compared to si-negative RNA (scramble) as a control. (B) Quantitative cell response index (CRI) values of the si-PANX1 RNA treatments relative to the control. n = 3. Error bars, s.e.m., exact p-values by a two-tailed t-test. (C) Fluorescence patterns in cells that first responded to the FUS stimulus after the treatments. One representative cell (top) is shown with fluorescence patterns in ten cells (bottom). (D) HEK293T cells transfected with WT PANX1 or mt PANX11–89-mRFP (mt PANX1-mRFP) constructs showed Ca2+ responses while control HEK cells transfected with dsRED construct have no FUS-induced Ca2+ response. (E) Quantitative CRI values of the transfected cells. n = 3. Error bars, s.e.m., ANOVA, Dunnet’s correction, exact p values.