
FIGURE 7.
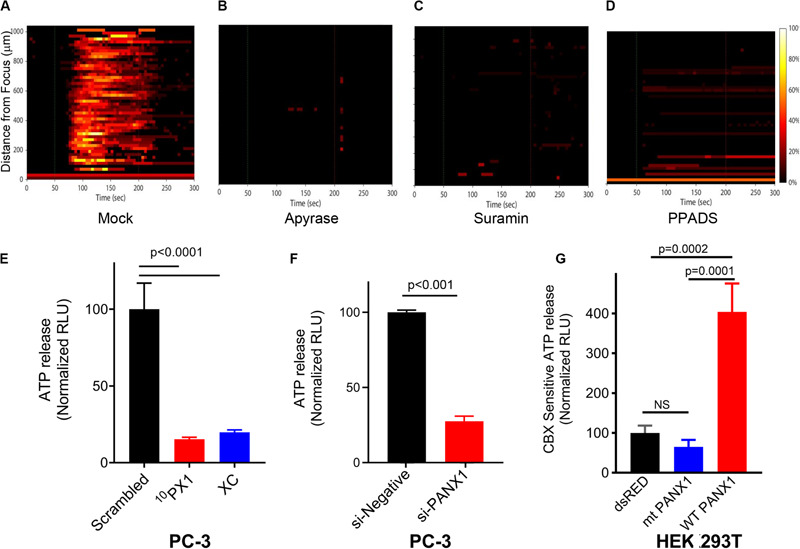
Effects of intercellular Ca2+ wave inhibitors on Ca2+ response (A–D), and effects of PANX1 modulation on ATP release (E–G). The responses are represented when PC-3 cells were treated with Apyrase, Suramin, PPADS and mock; Mock (A), 20–50 units/ml Apyrase (B), 100 μM Suramin (C), and 100 μM PPADS (D). The percentage of responding cells over time was shown. Experimental results presented are representative and were independently replicates at least two times with three independent biological samples. (E) Quantification of PANX1-mediated ATP release from PC-3 cells pretreated for 15 min with scrambled (SC), 10PX1, or Xestospongin C (XC). n = 4. ANOVA, Dunnet’s correction, exact p-values. (F) Quantification of PANX1-mediated ATP release from PC-3 cells transfected with control si-negative or si-PANX1 RNA. n = 4, p-values by a two-tailed t-test. (G) Quantification of PANX1-mediated ATP release from HEK cells transfected with dsRED, mt PANX1-mRFP or WT PANX1-EGFP, and pretreated for 10 min with CBX (500 μM). n = 3. ANOVA, Dunnet’s correction, exact p-values. Error bars, s.e.m., NS, not significant.