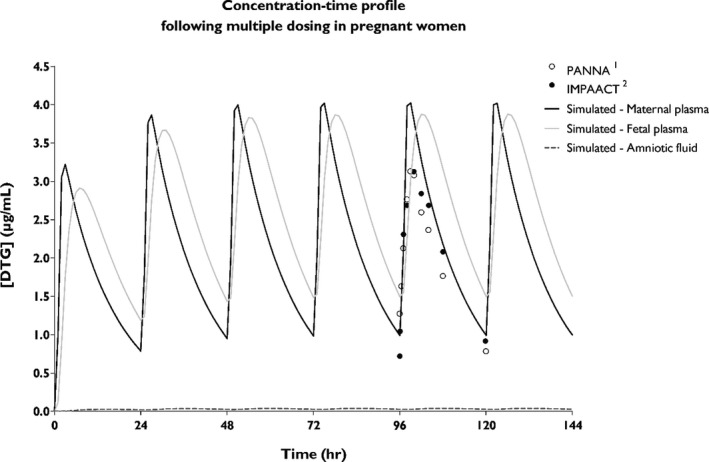
Figure 4.

Concentration‐time profile of dolutegravir (DTG) in pregnancy. The simulated concentration‐time profiles of maternal plasma (black line), fetal plasma (gray line), and in the amniotic fluid (dotted line) are shown upon multiple dosing of 50 mg DTG q.d. Clinical maternal plasma concentrations are indicated with dots, representing mean values reported by the PANNA network (n = 15) and the IMPAACT group (n = 28).33, 34
