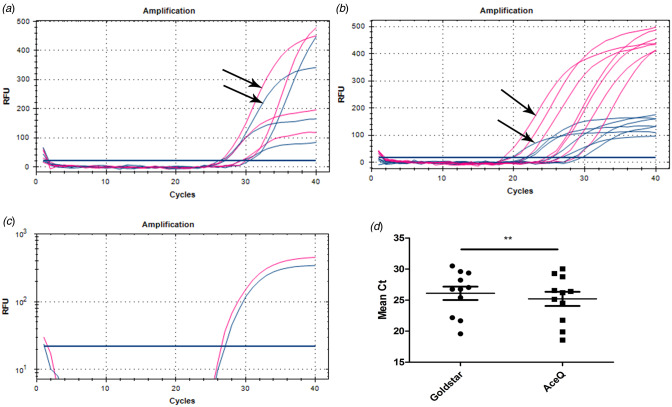
Fig. 2.
Amplification results of 11 swab samples in different DNA polymerase mixes, AceQ qPCR Probe Master Mix (red lines) and 2 × Goldstar Master Mix (blue lines). The black arrow indicates differences of Ct and RFU values in (A) four samples and (B) seven samples. (C) Amplification log plot in one of the 11 tested samples. (D) Comparison for mean Ct of 11 swab samples between the two master mixes. **P < 0.01.

