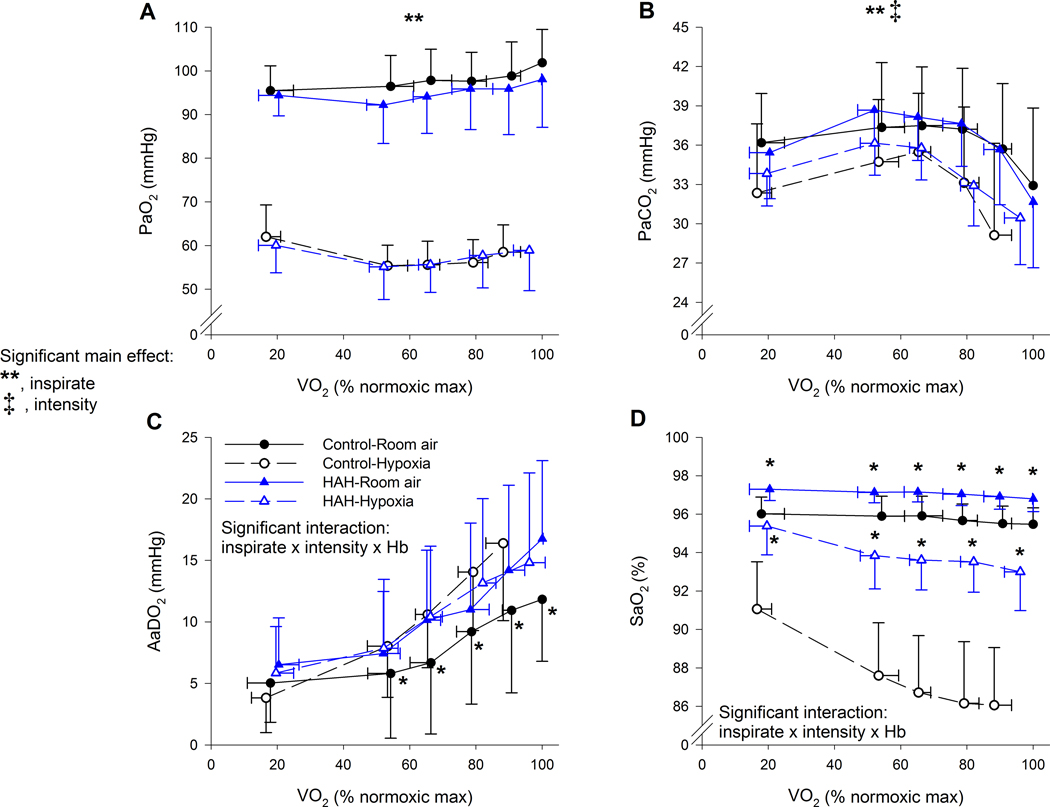
Figure 5.

Arterial blood gases, alveolar to arterial oxygen gradients and oxyhaemoglobin saturation for both exercise trials in controls and high affinity haemoglobin variants. There was a significant three-way interaction for Panels C and D. For Panel C, the asterix (*) represents the controls on room air were significantly lower than all other groups. For Panel D, the Asterix (*) represents that the high affinity subjects had significantly greater oxyhaemoglobin saturation for each inspirate. PaO2, arterial oxygen tension; PaCO2, arterial carbon dioxide tension; AaDO2, alveolar to arterial oxygen difference; FO2Hb, fraction of haemoglobin saturated with oxygen. ⩒O2, oxygen uptake. **, significant main effect of inspirate; ‡, significant main effect of intensity type. P<0.05.
