Fig. 2.
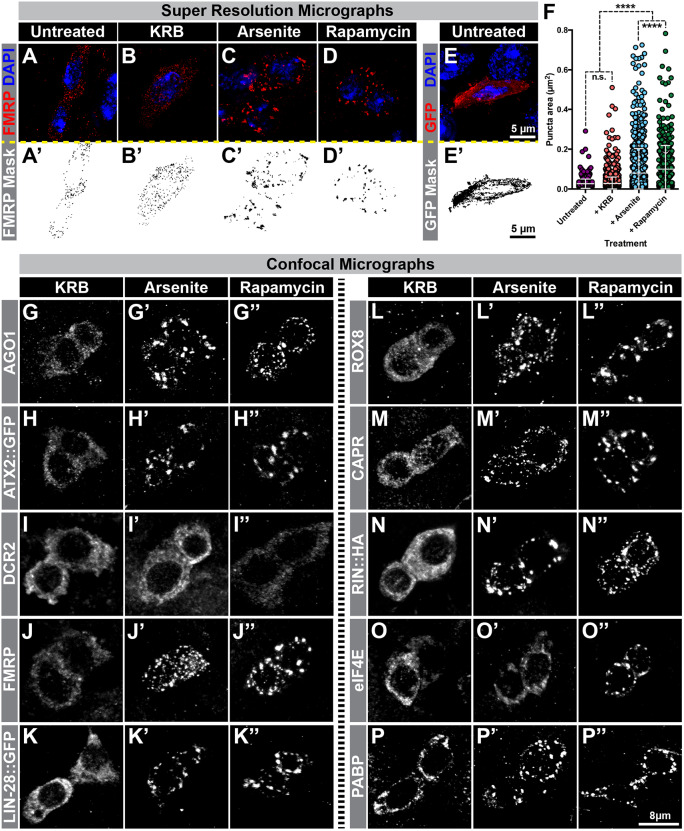
Arsenite and rapamycin treatment induce IPSGs. (A–E) Super resolution micrographs of intestinal progenitor cells that are either (A,E) untreated or treated with (B) KRB (control), (C) 1 mM sodium arsenite in KRB, or (D) 1 mM rapamycin in KRB and stained for FMRP (red in A–D, black in A′–D′) or GFP (red in E, black in E′) and DAPI (blue in A–E). (F) Scatter dot plots of FMRP puncta area in untreated progenitor cells (n=563 puncta, 7 cells) or following KRB (n=2039 puncta, 15 cells), 1 mM sodium arsenite (n=1096 puncta, 20 cells), or 1 mM rapamycin (n=476 puncta, 18 cells). Graph shows mean±s.d. ****P<0.0001; n.s., not significant (Kruskal–Wallis test). (G–P) Grayscale confocal micrographs of progenitor cell pairs from intestines treated with KRB (G–P), 1 mM sodium arsenite in KRB (G′–P′), or 1 mM rapamycin in KRB (G″–P″) and stained for (G–G″) AGO1, (H–H″) ATX2::GFP, (I–I″) DCR2, (J–J″) FMRP, (K–K″) LIN-28::GFP, (L–L″) ROX8, (M–M″) CAPR, (N–N″) RIN::HA, (O–O″) eIF4E and (P–P″) PABP.

