Fig. 5.

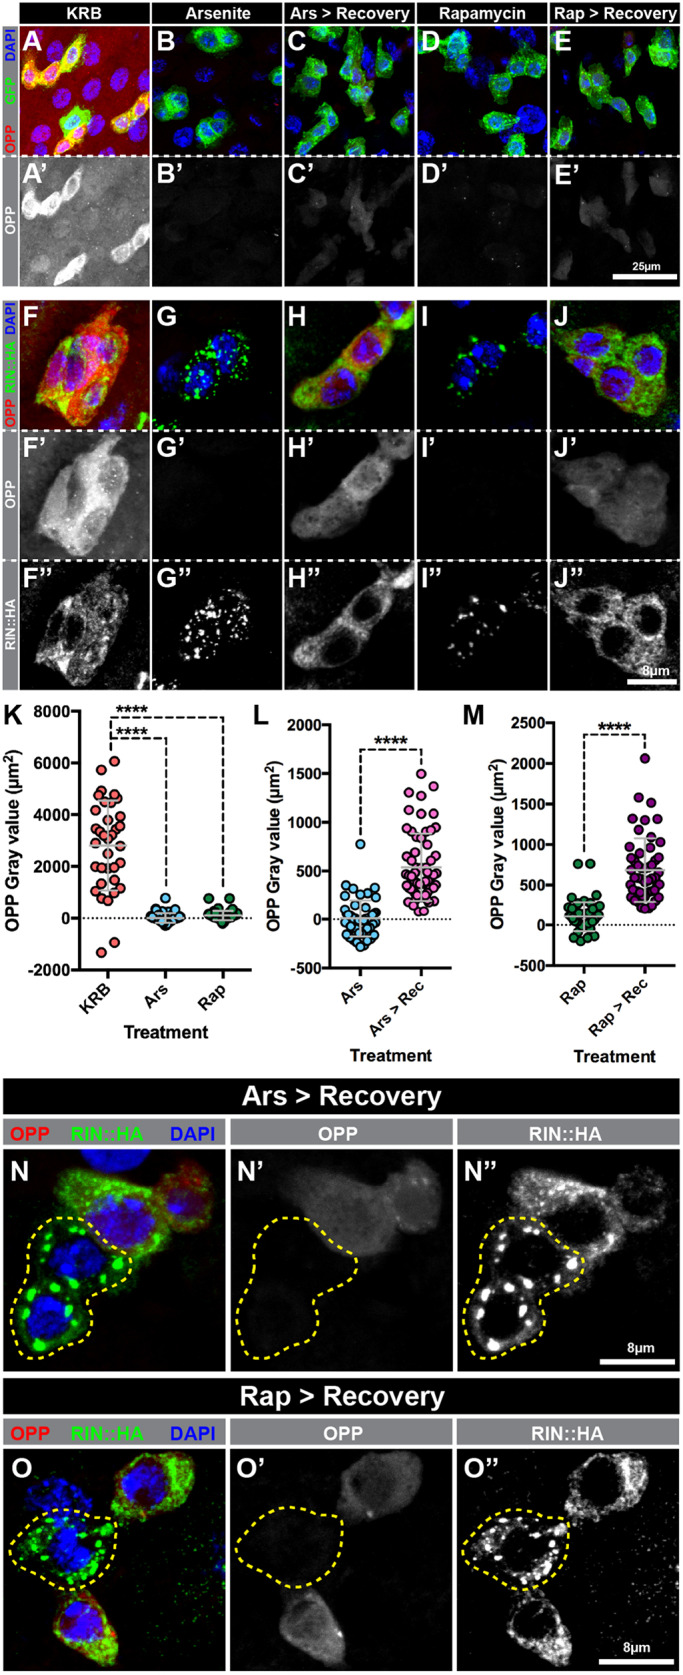
SG formation attenuates nascent protein synthesis in intestinal progenitor cells following acute stresses. Fluorescence micrographs of progenitor cells treated with (A,F) KRB for 45 min, (B,G) 1 mM sodium arsenite in KRB for 45 min, (C,H) 1 mM sodium arsenite in KRB for 45 min followed by Schneider's medium for 60 min, (D,I) 1 mM rapamycin in KRB for 45 min, or (E,J) 1 mM rapamycin in KRB for 45 min followed by Schneider's medium for 60 min and stained for (A–E) OPP (red in A–E, white in A′–E′), RIN::HA (green in A–E, white in A″–E″) and DAPI (blue), or (F–J) OPP (red in F–J, white in F′–J′), esg-Gal4>UAS-GFP (green) and DAPI (blue). (K) Scatter dot plot of normalized OPP fluorescence intensity of progenitor cells treated with KRB (n=35 cells, 6 intestines), 1 mM sodium arsenite in KRB (n=52 cells, 5 intestines) or 1 mM rapamycin in KRB (n=52 cells, 5 intestines). Normalized OPP fluorescence was calculated as the ratio of OPP fluorescence in progenitor cells relative to OPP fluorescence of neighboring cells. (L,M) Scatter dot plots of normalized OPP fluorescence intensity of progenitor cells treated with (L) 1 mM sodium arsenite in KRB (n=52 cells, 5 intestines) or 1 mM sodium arsenite in KRB followed by Schneider's medium (n=60 cells, 6 intestines), and (M) 1 mM rapamycin in KRB or 1 mM rapamycin in KRB followed by Schneider's medium (n=51 cells, 5 intestines). Graphs show mean±s.d. ****P<0.0001; n.s., not significant [Kruskal–Wallis test (K) and Mann–Whitney test (L,M)]. (N,O) Confocal micrographs of intestinal progenitors treated with (N) 1 mM sodium arsenite in KRB for 45 min followed by Schneider's medium for 60 min, or (O) 1 mM rapamycin in KRB for 45 min followed by Schneider's medium for 60 min and stained for OPP (red, N′ and O′), RIN::HA (green, N″ and O″) and DAPI (blue). Cells with persistent IPSGs are outlined by a yellow dotted line.
