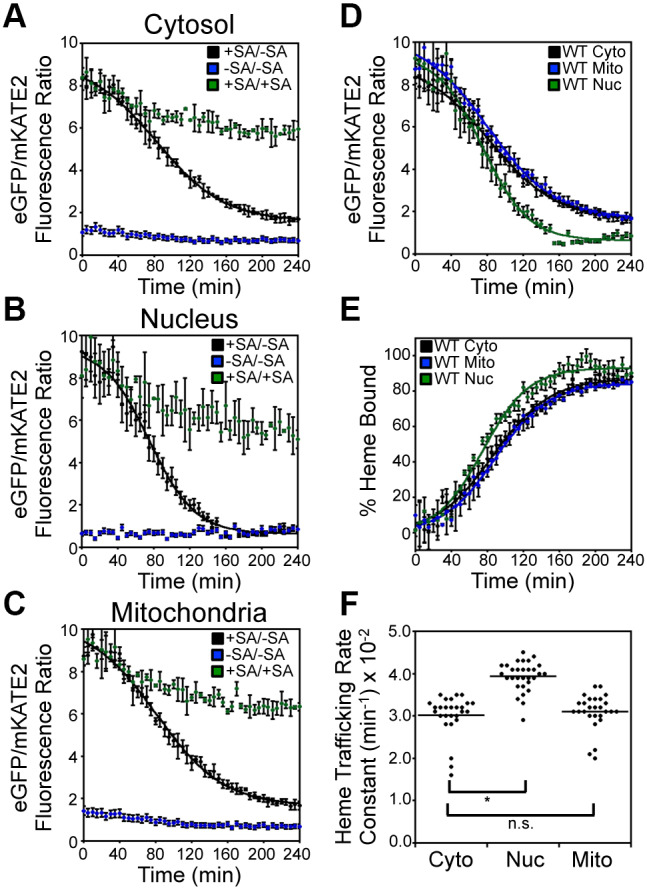
Fig. 2.

Inter-compartmental heme trafficking dynamics as measured by the heme sensor HS1. WT cells expressing HS1 in the cytosol (A), nucleus (B), or mitochondria (C) were either depleted of heme by addition of 500 μM succinylacetone (SA; heme biosynthetic inhibitor) before removal of SA to allow re-initiation of heme synthesis (+SA/−SA), or continually treated (+SA/+SA) or untreated (−SA/−SA) with SA. Upon re-initiation of heme synthesis in +SA/−SA samples, the rates of heme trafficking to the indicated subcellular locations were monitored by measuring the time-dependent change in sensor eGFP/mKATE2 fluorescence ratio (D) or the fractional saturation of HS1 (E), which is determined using Eqn 1 and the ‘raw’ fluorescence ratio values shown in A–C. The data in D and E are fitted to Eqn 2. (F) Rate constants for cytosolic, nuclear, and mitochondrial heme trafficking, which were extracted from fits to the data represented in E, for triplicate cultures in nine independent experimental trials, are shown. *P<0.0001; ns, not significant (one-way ANOVA with Dunnett's post-hoc test). Heme trafficking kinetics data shown in A–E represent mean±s.d. of independent triplicate cultures.
