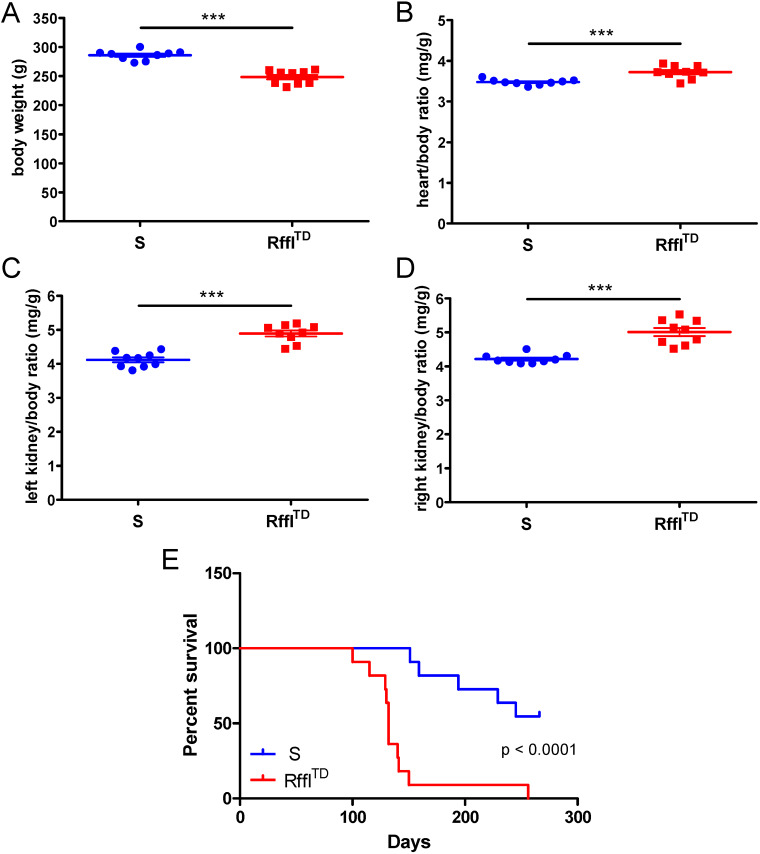
Fig. 7.
Lower body weight, worse heart hypertrophy, worse kidney hypertrophy and shorter survival were observed in RfflTD compared with S. (A) Body weight. (B) Heart/body weight ratio. (C) Left kidney/body weight ratio. (D) Right kidney/body weight ratio. (E) Kaplan–Meier survival curve. Tissue and body weights (n=9 rats per group) were collected at ∼9 weeks of age. The Gehan–Breslow–Wilcoxon test was used to calculate the P-value in the survival curve. Values are expressed as mean±s.e.m. ***P<0.001 (Student's t-test).

