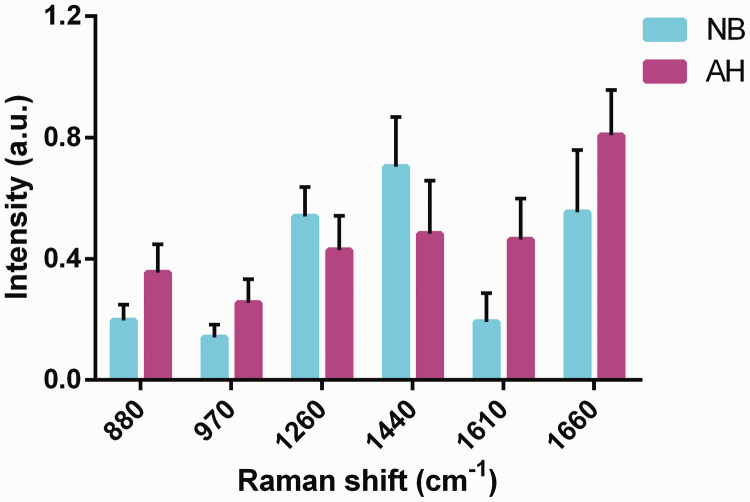
Figure 3.
Differences in relative contents of nucleic acids, proteins, and lipids between atypical hyperplasia (AH) and normal breast (NB) tissues. Characteristic nucleic acid peaks were 880 and 970 cm−1, lipid peaks were 1260 and 1440 cm−1, and protein peaks were 1610 and 1660 cm−1. The differences in all six peaks between the AH and NB tissues were significant (P < 0.001). NB, normal breast tissue; AH, breast atypical hyperplasia, a.u., arbitrary unit.

