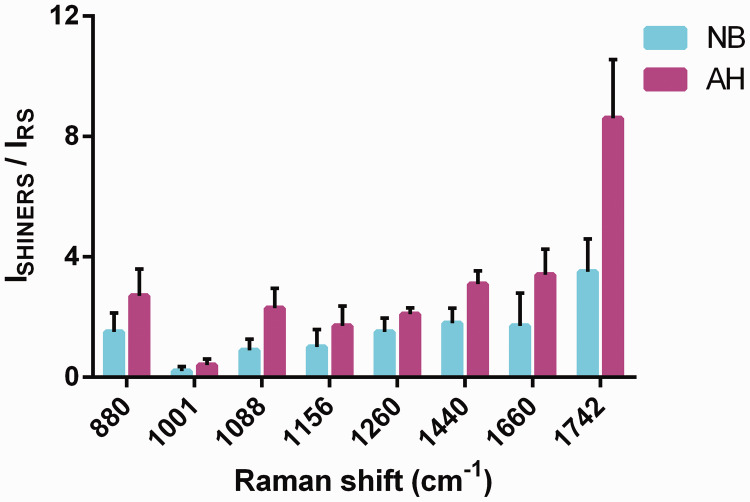
Figure 4.
The ratios of shell-isolated nanoparticle-enhanced Raman spectroscopy and Raman intensities of characteristic peaks of the main components in normal breast and atypical hyperplasia tissues. The characteristic protein peaks were 1001 and 1660 cm−1, lipids were 1260, 1440, and 1742 cm−1, nucleic acids were 880 and 1088 cm−1, and 1156 cm−1 was attributed to β-carotene. P < 0.001 for 1088, 1660, and 1742 cm−1 and P = 0.001 for 880 cm−1. In addition, the enhancement ratio differences for 1156 and 1440 cm−1 were significantly different (P = 0.037), but the differences for the 1001 and 1260 cm−1 groups were not significant. NB, normal breast tissues; AH, breast atypical hyperplasia, SHINERS, shell-isolated nanoparticle-enhanced Raman spectroscopy; RS, Raman scattering.

