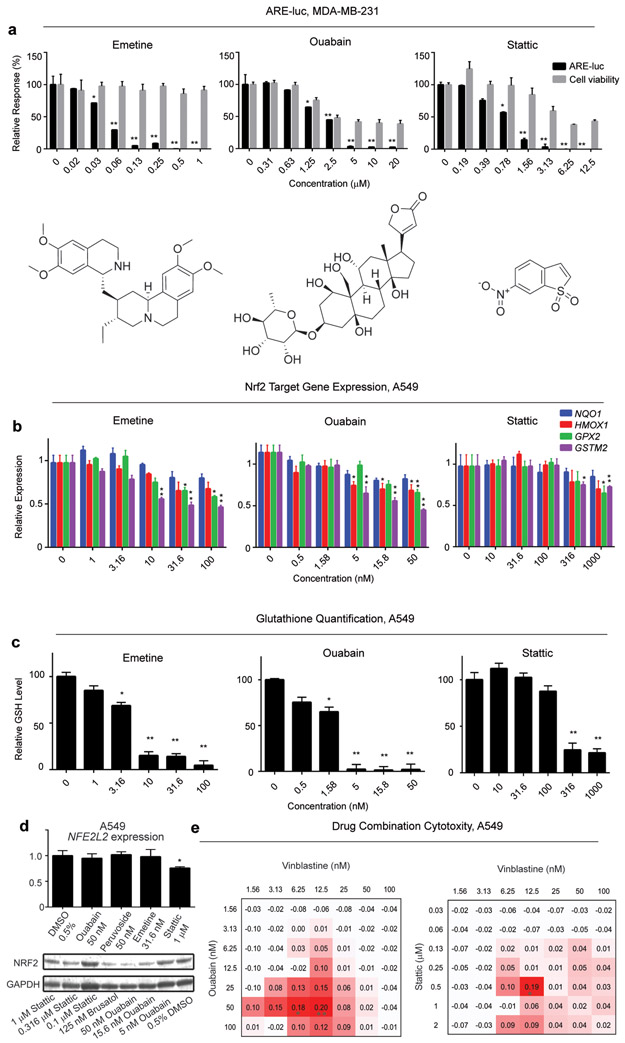
Figure 3.
(a) Representative secondary screen dose-response plots for the putative ARE inhibitors emetine, stattic and ouabain in the MDA-MB-231 ARE-luc reporter cell line expressed relative to the negative control (0.5% DMSO). (b) Nrf2 target gene expression in A549 cells after exposure to emetine, stattic and ouabain. A549 cells were exposed to the putative Nrf2 inhibitors for 24 h and the expression of the indicated Nrf2 target genes was quantified by RT-qPCR using GAPDH as the reference gene. (c) Total glutathione content of A549 cells after exposure to putative Nrf2 inhibitors. A549 cells were exposed to emetine, stattic and ouabain for 24 h and total glutathione was quantified with the colorimetric DTNB assay. Error bars represent ± SEM, * P ≤ 0.05, ** P ≤ 0.01 relative to negative control (One way ANOVA followed by Dunnett’s test). (d) Upper: NFE2L2 gene expression quantification by RT-PCR in response to ARE inhibitor treatment in A549 cells using GAPDH as the endogenous control. Error bars represent ± SD, *P ≤ 0.05, relative to 0.5% DMSO treatment (one way ANOVA followed by Dunnett’s test). Lower Nrf2 protein expression in response to 24 h treatment of the indicated Nrf2 (e) Δ Bliss independence calculations for A549 cells co-treated with oubain (left) and stattic (right) and vinblastine. A549 cells were treated with ouabain or stattic at the indicated concentrations for 6 h, followed by treatment with vinblastine at the indicated concentrations and viability was quantified using the MTT assay after a total of 72 h drug exposure. “Δ Bliss independence” is the difference between observed growth inhibition and Bliss expectation. Values greater than zero represent a synergistic response. Bliss expectation equals to C = (A+B) - (A×B), where A and B are the growth inhibition fractions of two compounds at a given dose and expressed relative to the negative control (0.5% DMSO). * P ≤ 0.05, ** P ≤ 0.01 relative the expected inhibitory effect of the two compounds (Student’s t-test).

