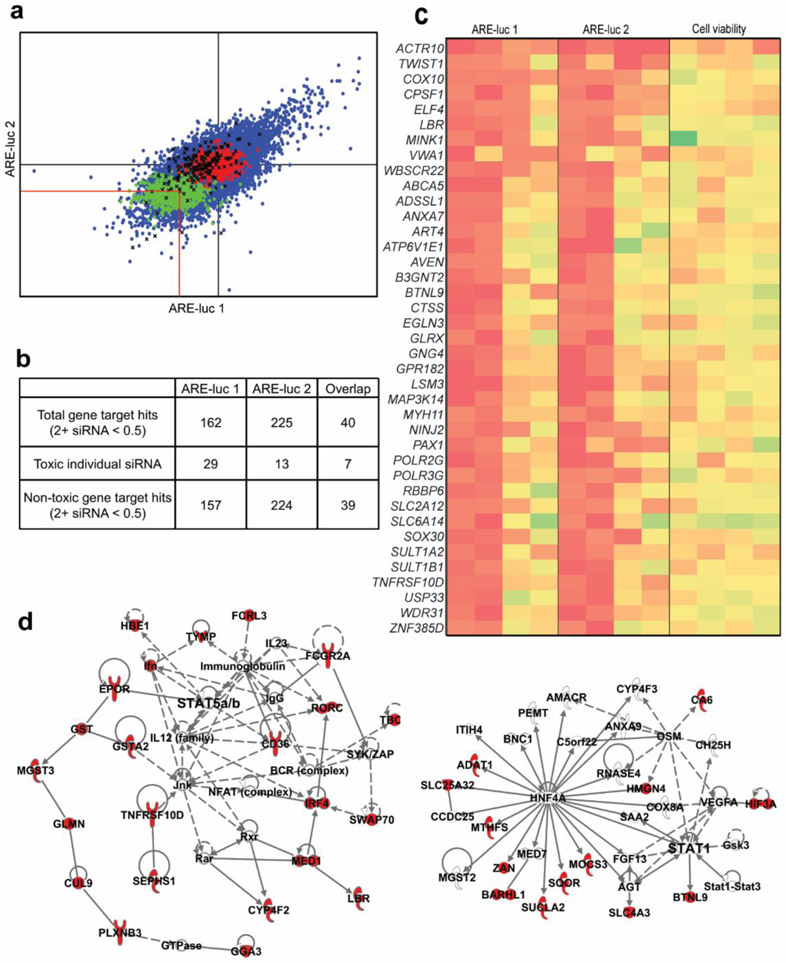
Figure 4.
Screen for siRNA modulators of Nrf2 activity. (a) Primary screens for siRNA Nrf2 modulators using the MDA-MB-231 ARE-luc reporter cell line. Raw luciferase output for each siRNA was expressed relative to the median luciferase values of the negative control present on each plate and the standardized scores of the two replicate screens are plotted against each other. The impact on viability of each siRNA was assessed in parallel and siRNA that caused greater than 50% toxicity were excluded from the downstream analyses. Red lines indicate the cutoff for hit siRNAs that decrease luciferase output by greater than 50%. Blue dots: test siRNA. Green dots: positive control siRNA (NFE2L2 SMARTpool). Red dots: negative control siRNA. Black X: toxic test siRNA. (b) Hit summary of the two siRNA ARE-luc inhibitor screens. The total number of gene hits is the number of genes targeted by more than two different siRNA from each screen. The total number of toxic individual siRNA is the number of single siRNA ARE-luc inhibitor hits that cause a greater than 50% decrease in viability. The number of non-toxic gene target hits is the number of genes targeted by more than two different siRNAs after the removal of the toxic individual siRNA hits. (c) Heatmap representing the standardized ARE-luc and viability scores for the overlapping set of siRNA ARE-luc inhibitor hits from the two replicate siRNA modulator screens. Each column represents a single siRNA targeting the indicated gene (d) Two examples of enriched networks resulting from the IPA analysis of the combined list of ARE-luc inhibitor gene hits from both ARE-luc screens. Red nodes are genes present in the combined list of ARE-luc inhibitor genes hits, colorless nodes are genes that interact with the ARE-luc inhibitor gene hits. Solid edges represent physical interaction between the protein products of the indicated genes. Dashed edges represent non-physical, functional interactions between the indicated genes or their protein products.

