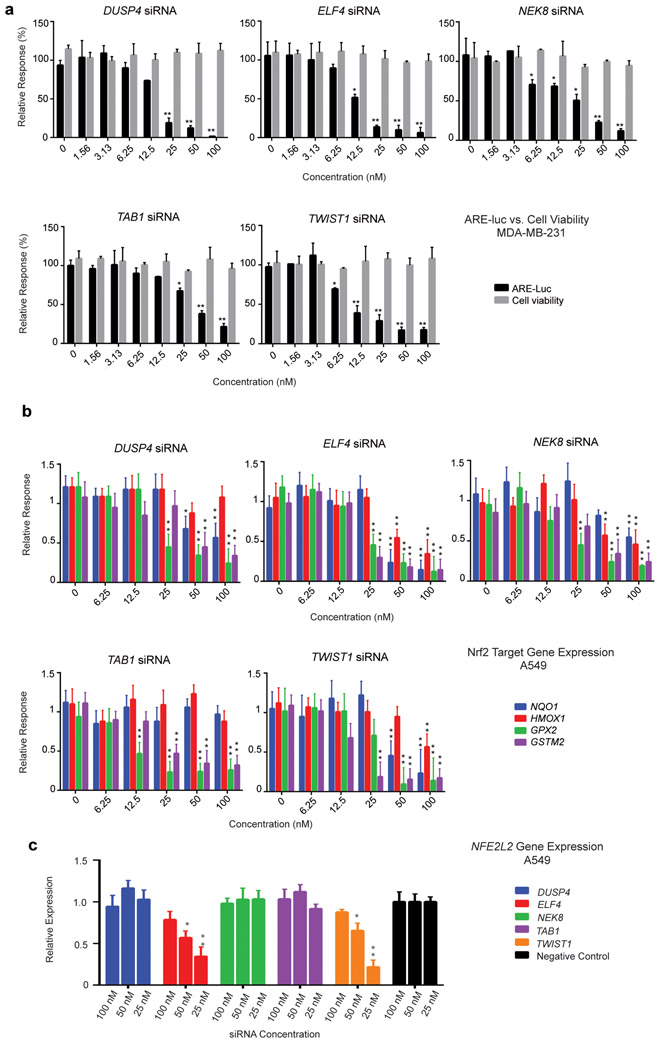
Figure 5.
Validation of selected ARE-luc inhibitor gene hits using two different siRNAs targeting genes identified in the high-throughput MDA-MB-231 ARE-luc modulator screen. (a) Dose-response ARE-luc and cell viability assay. The two different siRNA targeting the indicated genes were transfected at the indicated concentrations into the MDA-MB-231 ARE-luc reporter cell line. ARE-luc output and cell viability was quantified 72 h post-transfection using the BriteLite reagent and the MTT assay. The assay was performed in triplicate with two different siRNA, raw luciferase and MTT assay values are expressed relative to the non-targeting siRNA negative control. The mean and standard deviation of the relative luciferase and MTT assay values were calculated. (b) Nrf2 target gene expression in response to transfection with two different siRNA targeting the indicated genes. The expression of four Nrf2 target genes (NQO1, HMOX1, GPX2 and GSTM2) was quantified by RT-qPCR using GAPDH as the reference gene. Error bars represent ± SEM, * P ≤ 0.05, ** P ≤ 0.01 (One way ANOVA followed by Dunnett’s test) relative to negative control. (c) NFE2L2 gene expression in A549 cells in response hit siRNA treatment. The effect of treatment with three concentrations of two independent siRNA for each putative ARE inhibitor gene on NFE2L2 gene expression was quantified by RT-qPCR. NFE2L2 expression in response to hit siRNA is expressed relative to that of the negative control siRNA treatment and the average of the two independent siRNA is depicted. GAPDH was used as the endogenous control gene. Error bars represent ± SEM, * P ≤ 0.05, ** P ≤ 0.01 (One way ANOVA followed by Dunnett’s test) relative to negative control siRNA.

