Figure 6.
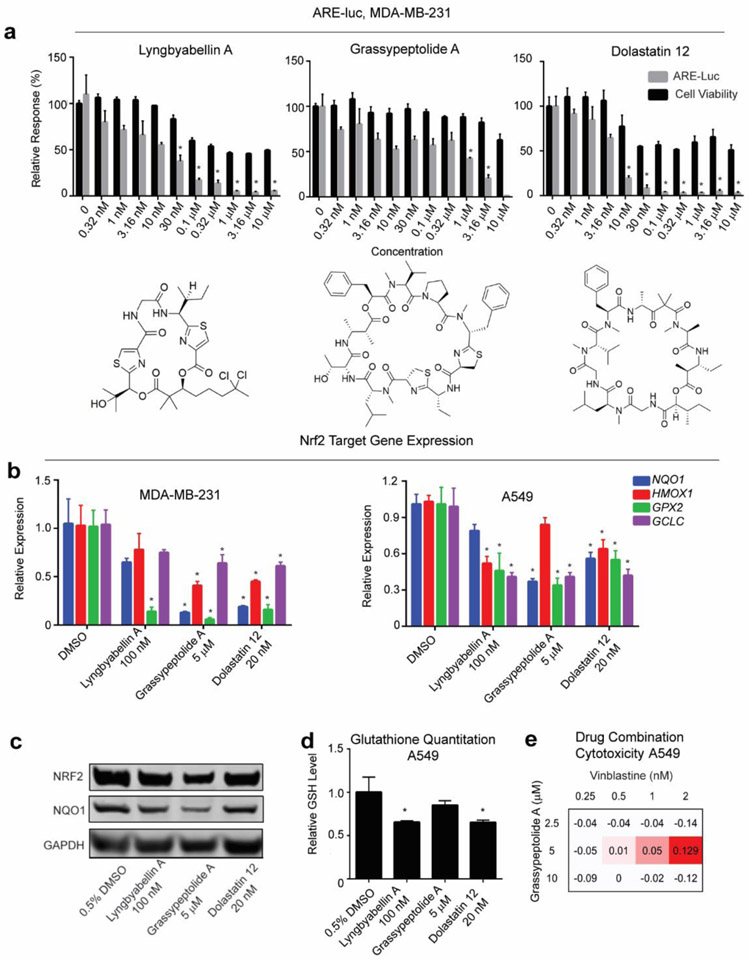
Inhibitor hits from natural product library screening. (a) Structure of lyngbyabellin A, grassypeptolide A and dolastatin 12 with their differential ARE inhibitory effects versus cell viability from MDA-MB-231 ARE-luc reporter assay. Error bars represent ± SEM. (b) Transcriptional expression levels of NQO1, HMOX1, GPX2 and GCLC decreased in MDA-MB-231 and A549 cells upon treatment of natural product inhibitor hits for 24 h, with GAPDH as endogenous control. Error bars represent ± SEM. (c) Quantification of Nrf2 and its target NQO1 protein expression by western blot with GAPDH as endogenous control after 24 h treatment with natural products Nrf2 inhibitors in A549 cells. (d) A549 cellular reduced glutathione (GSH) content level decreased after 24 h natural product Nrf2 inhibitor hits treatment. In each case error bars represent ± SEM * P < 0.05 relative to vehicle control (One way ANOVA followed by Dunnett’s test). (e) Δ Bliss independence calculations for A549 cells co-treated with grassypeptolide A and vinblastine. A549 cells were treated with grassypeptolide A in serial concentrations for 24 h, followed by treatment with vinblastine in serial concentrations for 24h. “Δ Bliss independence” is the difference between observed growth inhibition and Bliss expectation. Values greater than zero represent a synergistic response. Bliss expectation equals to C=(A+B)-(A×B), where A and B are the growth inhibition fractions of two compounds at a given dose. Cell viability was quantified using MTT assay.

