
Figure 3.
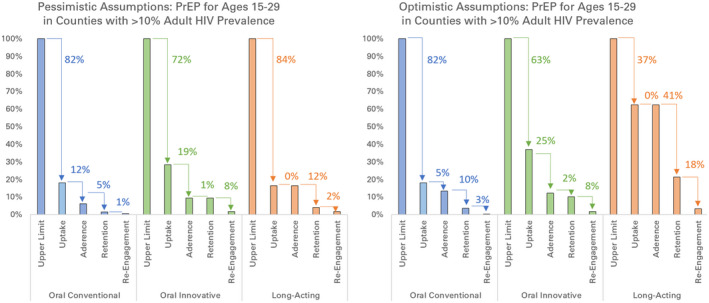
Percentage of infections averted along prevention cascades with pessimistic and optimistic assumptions.
Arrows show absolute percentage decrease relative to the previous step of the cascade. Prevention cascades are shown for conventional implementation of oral PrEP (blue), innovative implementation of oral PrEP (green), and long‐acting PrEP (orange) in western Kenya, under assumptions described in Table 1. The population receiving PrEP is men and women ages 15 to 29 in counties with HIV prevalence exceeding 10% (Homa Bay, Siaya, Kisumu, and Migori). Infections averted are calculated for the entire population, including those not on PrEP. PrEP, pre‐exposure prophylaxis