
Figure 4.
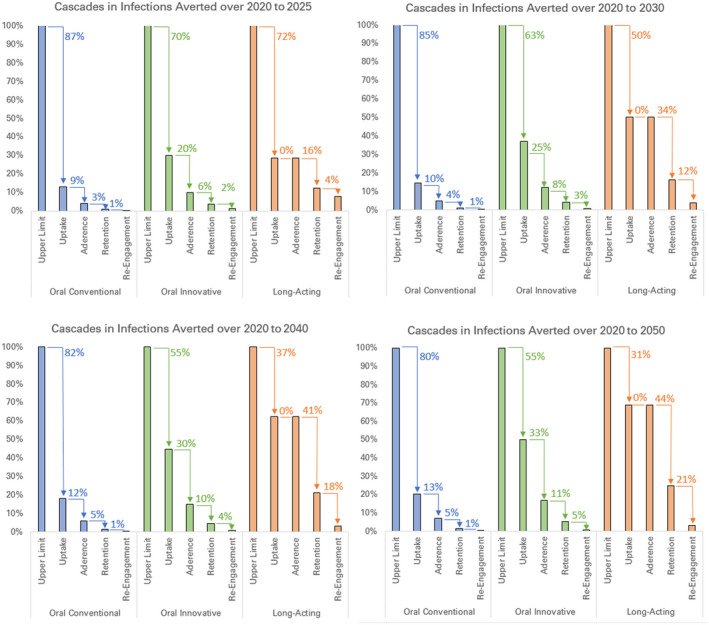
Percentage of infections averted along prevention cascades over different time horizons of analysis.
Arrows show absolute percentage decrease relative to the previous step of the cascade. Prevention cascades for conventional implementation of oral PrEP (blue), innovative implementation of oral PrEP (green), and long‐acting PrEP (orange) in western Kenya were organized into the uptake, adherence, retention and re‐initiation of those at risk who have discontinued PrEP. The population receiving PrEP is men and women ages 15 to 29 in counties with HIV prevalence exceeding 10%. Infections averted is calculated for the entire population, including those not on PrEP. Infections averted are cumulative over time horizons of 2020 to 2025 (top left), 2020 to 2030 (top right), 2020 to 2040 (bottom left) and 2020 to 2050 (bottom right). PrEP, pre‐exposure prophylaxis