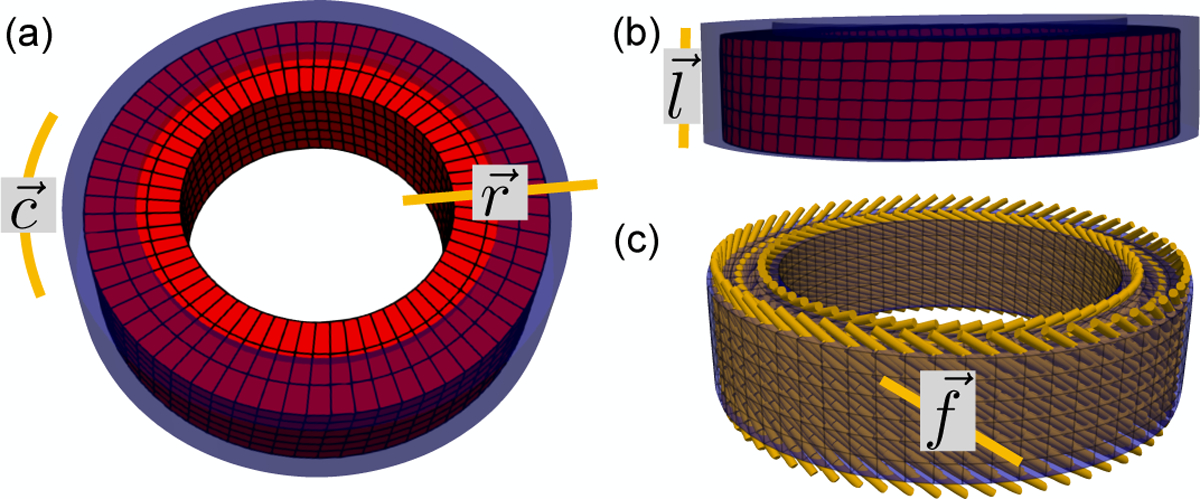
Fig. 1.

Analytic deforming phantom, (a) Axial and (b) longitudinal views of the analytic phantom at beginning (blue) and end (red) systole. Circumferential (), radial (), and longitudinal () directions are also shown, (c) Cardiomyocyte () directions were prescribed in the phantom according to a rule-based approach calibrated on histological data.
