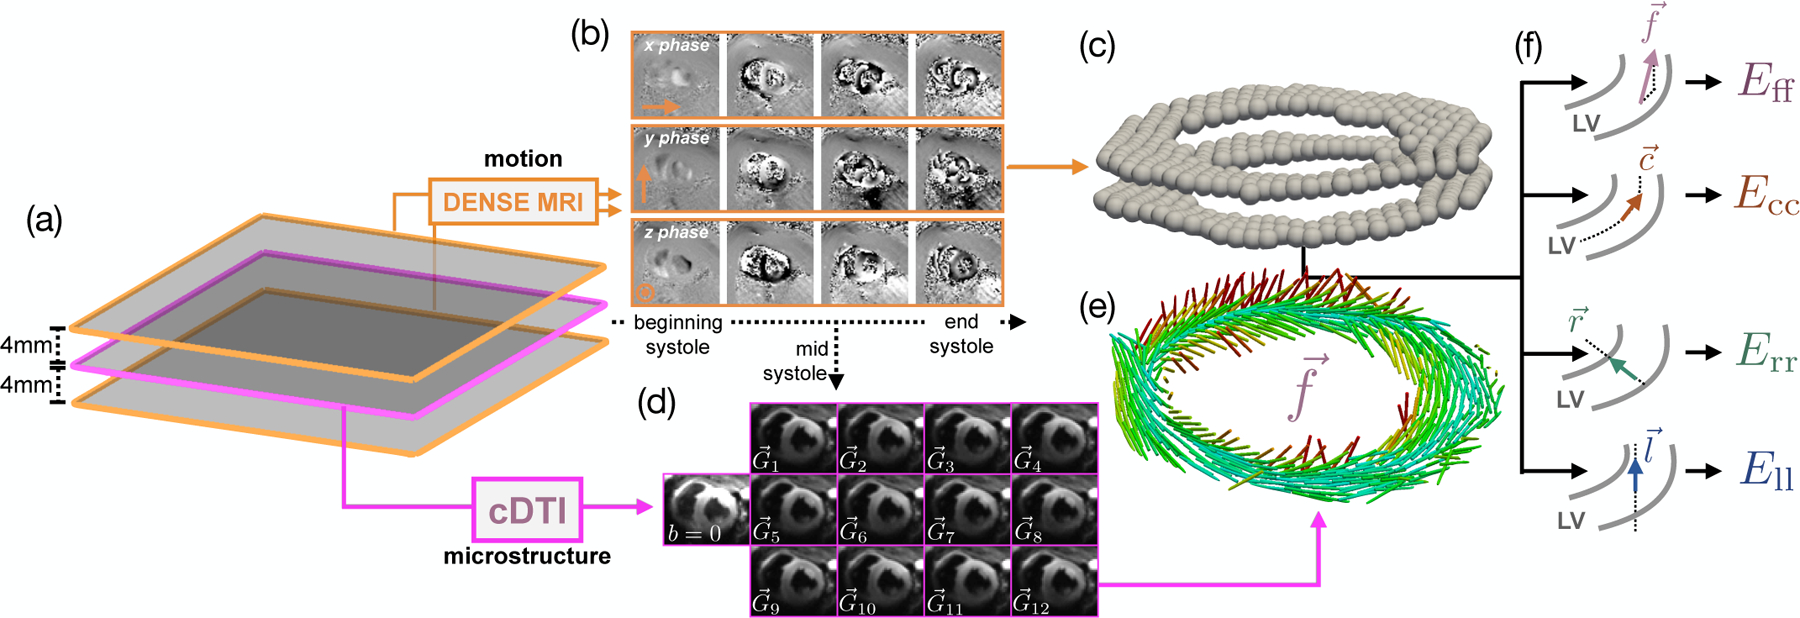
Fig. 7.

Model construction pipeline, (a) Two short-axis DENSE MR images were acquired 4mm above and below the cDTI location, (b) Example of acquired phase data in x, y, and z throughout systole, (c) Processed 3D deformation used to compute the deformation gradient tensor F at the location of the cDTI voxels, (d) Example of mid-systolic diffusion weighted images () acquired in vivo in one subject, (e) Preferential aggregate cardiomyocyte orientations for each voxel of the cDTI data, (f) Schematic demonstrating how the cardiomyocyte, circumferential, radial, and longitudinal directions are computed. The two gray curves represent the epicardial and endocardial contours of the LV.
