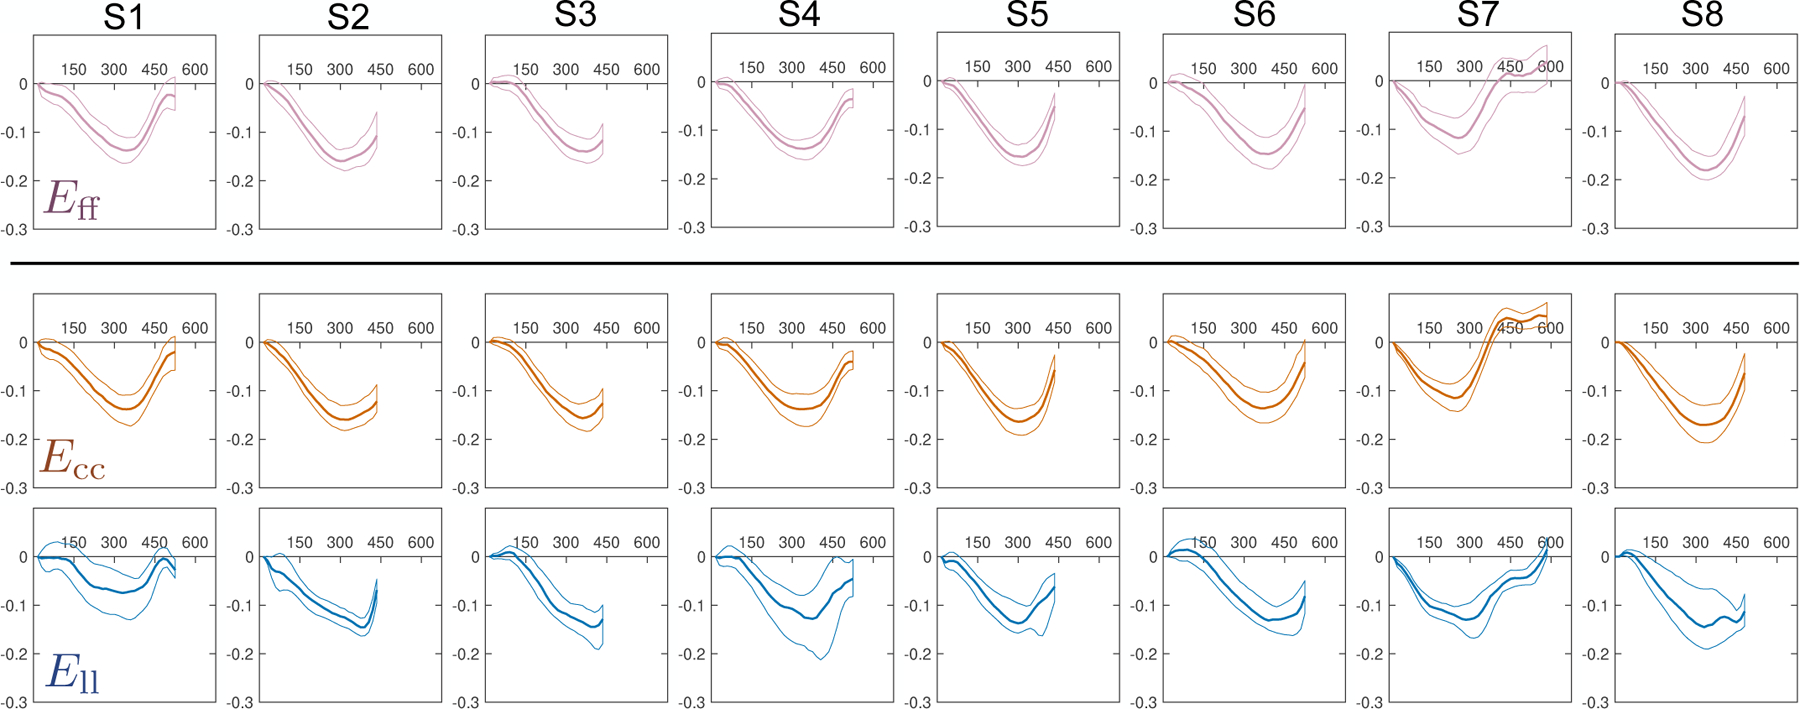
Fig. 9.

Eff, Ecc, Ell, and Err through time (horizontal axis, measured in [ms]) across all subjects (S1–S8). Solid lines represent the median at each cardiac phase, while thin lines represent the 25th and 75th quartiles. The reference state for all strains (i.e., Evv = 0) was defined as the beginning of systole (time=0ms).
