
Figure 2: HSV encoded miR-H16 induces NOTCH signaling.
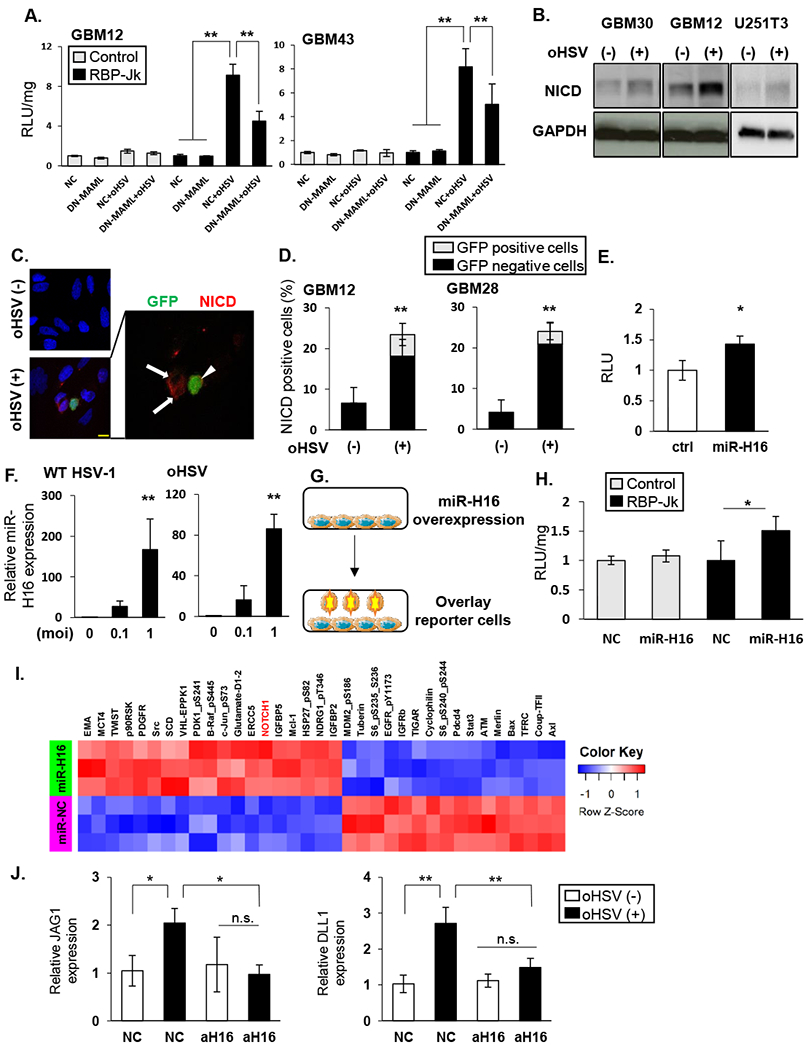
A: The indicated GBM cells transduced with DN-MAML or empty control plasmid (NC) were infected with 34.5ENVE (oHSV) for one hour. After unbound virus was washed out, they were overlaid with NOTCH reporter cells and change in luciferase activity was measured (RLU). B: Western blot of the indicated cell lysates probed for NOTCH intracellular domain (NICD) with 34.5ENVE (MOI = 0.1) (+) or without (−) infection. C: Immuno-fluorescent staining of NICD in infected glioma cells. Representative fluorescent microscopy images of GBM28 cells stained for NICD (red). DAPI (blue) shows nuclear staining, and GFP indicates virus-infected cells. Uninfected cells (arrow) around infected cells (arrowhead) showed NICD. D: Quantification of NICD staining with (+) or without (−) 34.5ENVE infection in indicated GBM cells. Mean NICD positive cells/view field ± SD. E: Relative NOTCH reporter activity in glioma cells transduced with control or HSV-1 encoded miR-H16 (n = 4/group). F: Expression of miR-H16 in glioma cells infected with 34.5ENVE or w.t. HSV-1 by qRT-PCR. G-H: miR-H16 transduced cells can activate NOTCH activity in adjacent cells. G: Schema of experimental set up in H. LN229 cells transfected with miR-H16 or control miRNA (NC) were overlaid with control (white bars) or NOTCH reporter cells (black bars). H: Mean change in relative luciferase activity measured 12 hours after reporter cell overlay (n = 4). I: Heatmap of significant changes in protein expression from Reverse Phase Protein Array (RPPA) analysis of control and miR-H16 transfected cells. Unsupervised hierarchical clustering of normalized RPPA data (n=3/group). J: GBM12 cells transduced with antagomir for miR-H16 (amiR-H16) or control (amiR-NC) were treated with 34.5ENVE (MOI = 0.1). Changes in NOTCH ligand expression was measured by qRT-PCR. Data shown are the mean ± SD relative to control cells (n≥ 3). *P<0.05, **P<0.01. Scale bar, 10µm