
Figure 3.
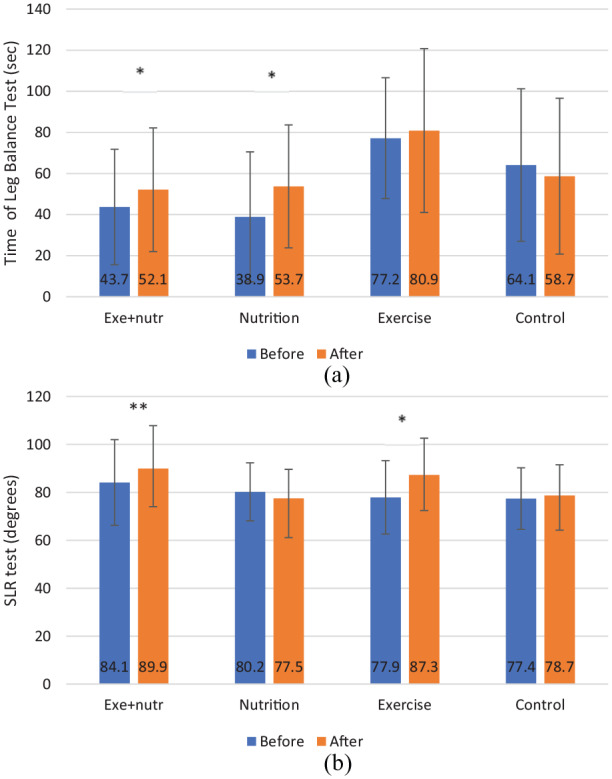
One-leg balance test and range of motion of the hip joint before and after the program. (a) One-leg balance test before and after the program. Values shown are the means and the standard deviations are represented by vertical bars. Balance was measured using the one-leg balance test before and after the different programs. The difference before and after was measured using a t-test analysis for dependent samples. (b). Range of motion of the hip joint before and after the program. Values shown are the means and the standard deviations are represented by vertical bars. The range of motion of the hip joint was measured using the straight leg raise (SLR) test before and after the different programs. The difference was measured using a t-test analysis for dependent samples.
*p < 0.05, **p < 0.01.