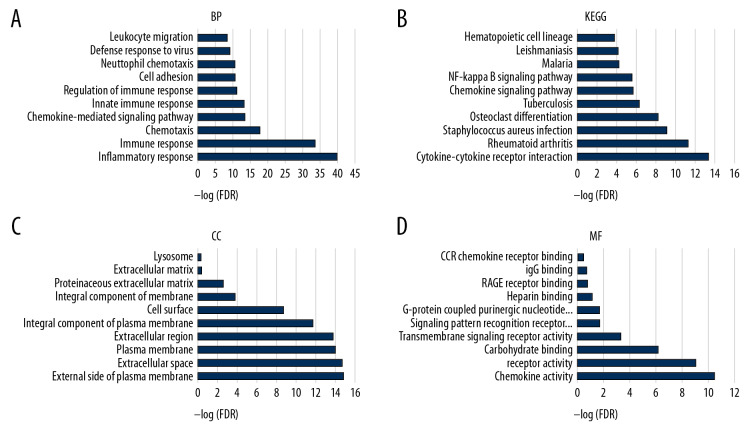
Figure 3.
The functional enrichment analysis of DEGs was performed. The analysis results of TOP10 are shown in the picture. The false discovery rate (FDR) of GO analysis was obtained from the DAVID function annotation tool. (A) biological process analysis; (B) KEGG Pathway analysis; (C) cellular component analysis; (D) molecular function analysis.

