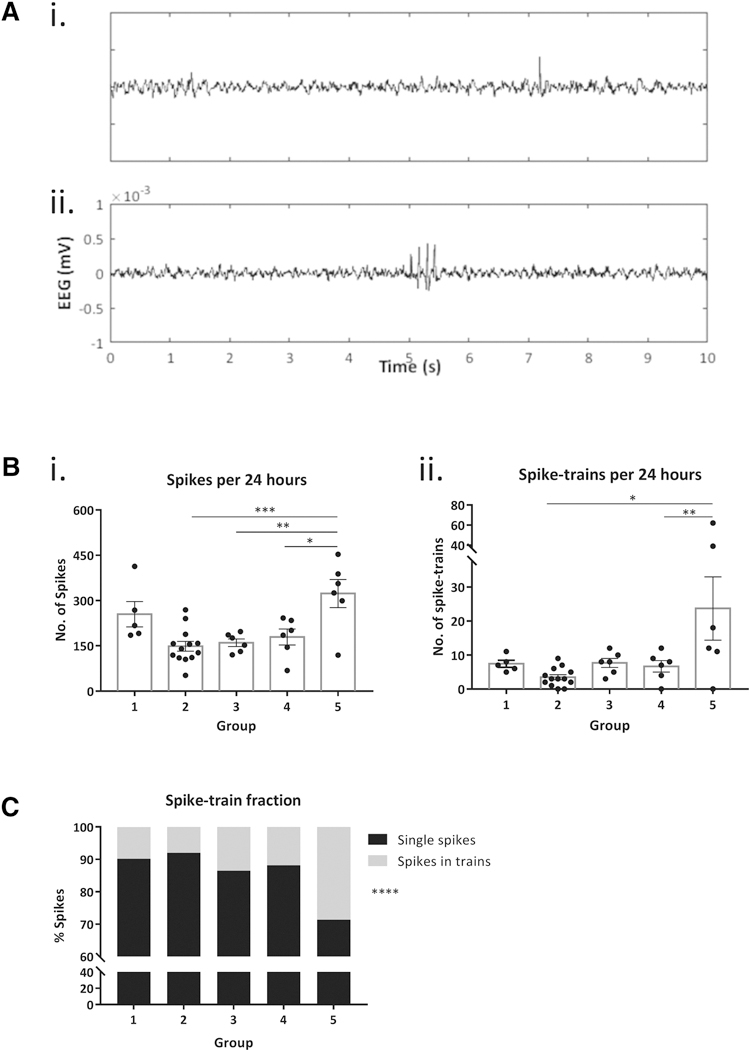
Figure 1. Epileptiform EEG spiking in 24h.

A: Representative traces show background EEG with (i) a single spike and, (ii) a spike train. B: (i) 100% mice exhibited single epileptiform spikes in 24 h EEG. One-way ANOVA demonstrates a significant group effect in the average spike frequency (p=0.003) and Tukey’s post-hoc comparisons show significant differences between group 5 vs groups 2, 3 and 4, respectively. Bars indicate mean ± SEM and scatter dots represent individual values. (ii) 90% mice recorded spike trains comprising at least 3 consecutive spikes in 24-h EEG. The number of spike trains was significantly different among groups (p=0.004) and Tukey’s post-hoc test shows differences in group 5 vs group 2 and 4, respectively. Error bars indicate SEM and scatter dots represent individual values. C: Stacked bar plot shows the fraction of total spiking activity that is composed of single spikes vs spikes in trains, per group. 85.6% of spikes across all mice were isolated. Groups include naïve C57 WT mice (group 1, n=5), WT littermate controls of autism mouse models of Shank3b (group 2, n=13), Gabr3b (group 3, n=6), Cntnap2 (group 4, n=6), and Pten (group 5, n=6). *p<0.05, **p<0.01, ***p<0.001, ****p<0.0001
