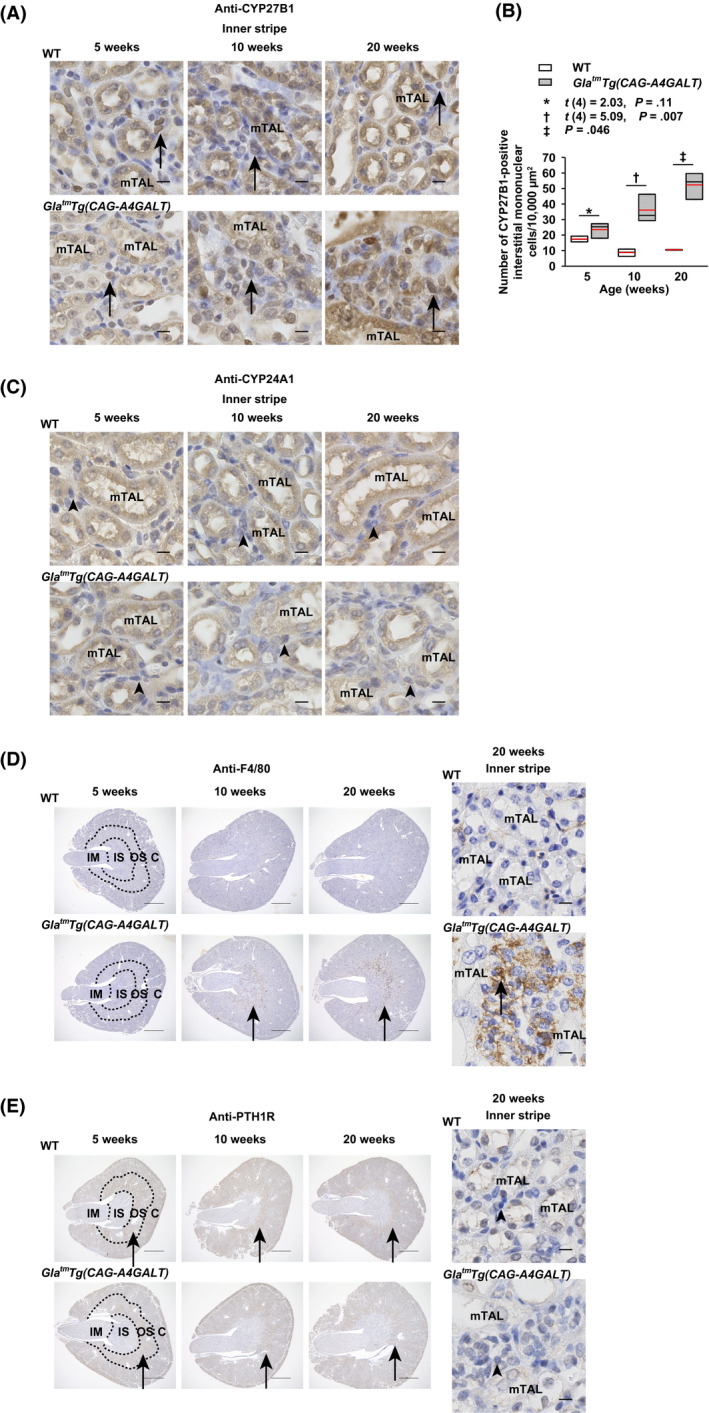
FIGURE 8.

The infiltrating interstitial mononuclear cells of GlatmTg(CAG‐A4GALT) mice produce 1α‐hydroxylase (CYP27B1). A, Micrographs of CYP27B1‐positive mononuclear cells in the inner stripe of GlatmTg(CAG‐A4GALT) and WT mice (n = 3/group) mouse kidneys. Arrows indicate CYP27B1‐positive mononuclear cells. Scale bars = 10 μm. B, Quantification of the CYP27B1‐positive mononuclear cells in the inner stripe of GlatmTg(CAG‐A4GALT) and WT mice (n = 3/group) mouse kidneys. CYP27B1‐positive mononuclear cells in three 10000‐μm2 square fields with noticeable mononuclear cells were counted, and the mean value is shown for each mouse. C, Micrographs of CYP24A1‐negative mononuclear cells in the inner stripe of GlatmTg(CAG‐A4GALT) and WT mice (n = 3/group) mouse kidneys. Arrowheads indicate CYP24A1‐negative mononuclear cells. Scale bars = 10 μm. D, Micrographs of F4/80‐positive macrophages in the inner stripe of GlatmTg(CAG‐A4GALT) and WT mice (n = 3/group) mouse kidneys. Arrows indicate F4/80‐positive macrophages. Scale bars = 1 mm (left) and 10 μm (right). E, Micrographs of PTH1R‐negative mononuclear cells in the inner stripe of GlatmTg(CAG‐A4GALT) and WT mice (n = 3/group) mouse kidneys. Arrows indicate PTH1R‐positive PST. Scale bars = 1 mm (left) and 10 μm (right). In box‐and‐whisker plots (B), center lines represent the median, box limits represent quartiles, whiskers represent the 10th and 90th percentiles, and red lines represent the mean. Differences between groups were evaluated with the Student's t test or Wilcoxon rank‐sum test; data are shown as t (integral degree of freedom) = t value and P value (Student's t test) or a P value only (Wilcoxon rank‐sum test). C, cortex; IM, inner medulla; IS, inner stripe; mTAL, medullary thick ascending limb; OS, outer stripe; PST, proximal straight tubule; PTH1R, parathyroid hormone 1 receptor
