
FIGURE 9.
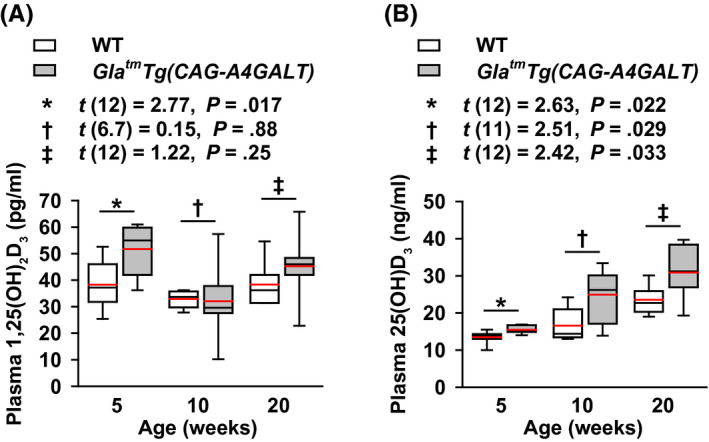
GlatmTg(CAG‐A4GALT) mice exhibit an increase in vitamin D. A and B, Plasma 1,25(OH)2D3 (A) and 25(OH)D3 (B) levels in GlatmTg(CAG‐A4GALT) (5 wk old, n = 7; 10 wk, n = 7; and 20 wk, n = 7) and WT (5 wk old, n = 7; 10 wk, n = 6; and 20 wk, n = 7) mice. In box‐and‐whisker plots, center lines represent the median, box limits represent quartiles, whiskers represent the 10th and 90th percentiles, and red lines represent the mean. Differences between groups were evaluated with the Student's t test or Welch's t test; data are shown as t (integral degree of freedom) = t value and P value (Student's t test) or t (mixed decimal degree of freedom) = t value and P value (Welch's t test). 25(OH)D3, 25‐hydroxyvitamin D3; 1,25(OH)2D3, 1α,25‐dihydroxyvitamin D3