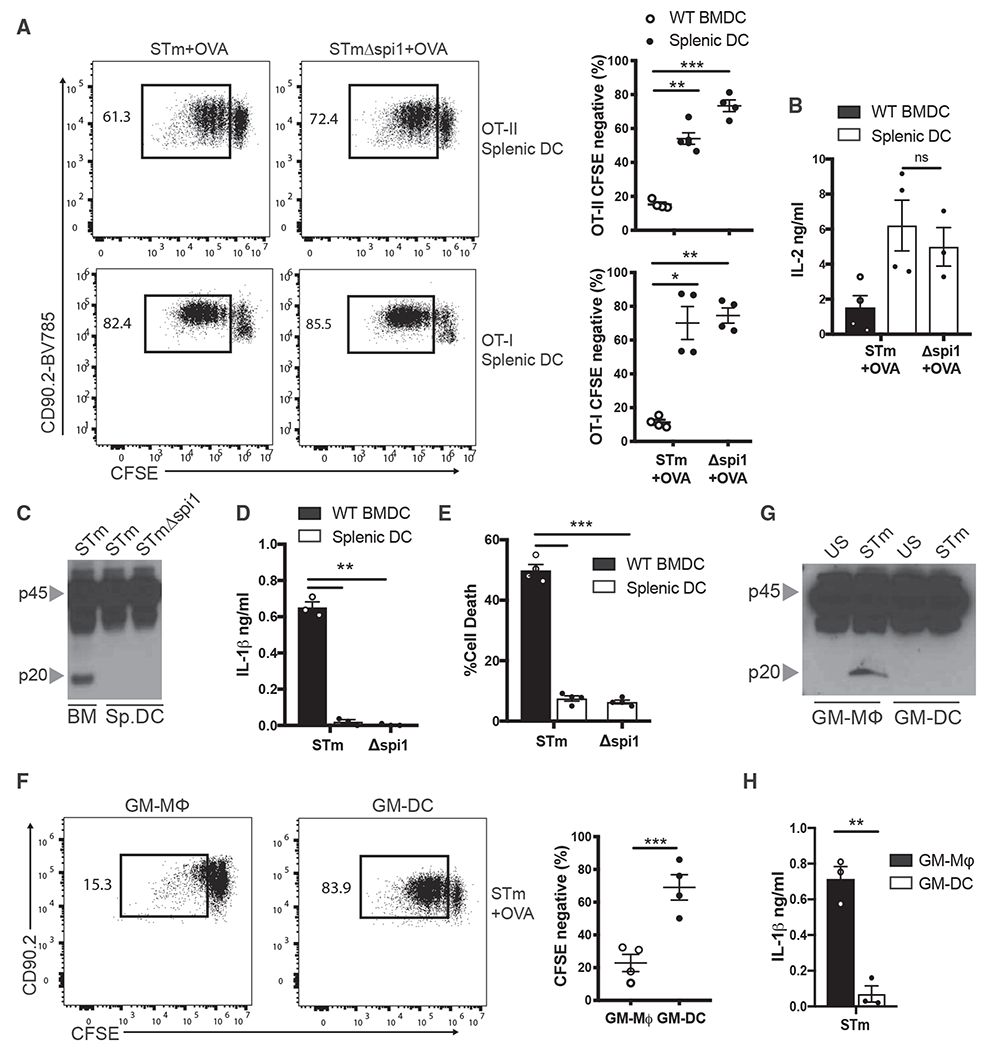
Figure 3. Splenic DCs Suppress Inflammasome Activation and Prime T Cells in Response to Virulent Pathogens.

(A) OT-II and OT-I T cell proliferation was quantified by flow cytometry following 72 h of culture with WT CD11c+ splenic DCs that were pulsed with STm or STmΔspi1 in and OVA.
(B) IL-2 was measured by ELISA in the supernatants of the cultures from (A).
(C) Immunoblot analysis of pro-casp1 (p45) and cleaved casp1 (p20) in the lysates of WT BMDCs and CD11c+ splenic DCs pulsed with STm or STmΔspi1 for 1 h.
(D and E) IL-1β was measured by ELISA (D), and (E) cell death was measured by LDH release in the supernatants of WT BMDCs and CD11c+ splenic DCs from (C).
(F) OT-II T cell proliferation was quantified by flow cytometry following 72 h of culture with FACS-sorted GM-Macs (CD11c+MHCIIintCD115+) and GM-DCs (CD11c+MHCII+CD115−) that were pulsed with STm and OVA.
(G) Immunoblot analysis of pro-casp1 (p45) and cleaved casp1 (p20) in the lysates of FACS-sorted GM-Macs and GM-DCs pulsed with STm for 1 h.
(H) IL-1β was measured by ELISA in the supernatants of GM-Macs and GM-DCs from (G).
See also Figures S1 and S2. Error bars indicate SEM; (A, B, D–F, and H) paired t test; (C and G) data representative of three independent experiments. *p<0.05, **p<0.01, ***p<0.001; ns, not significant.
