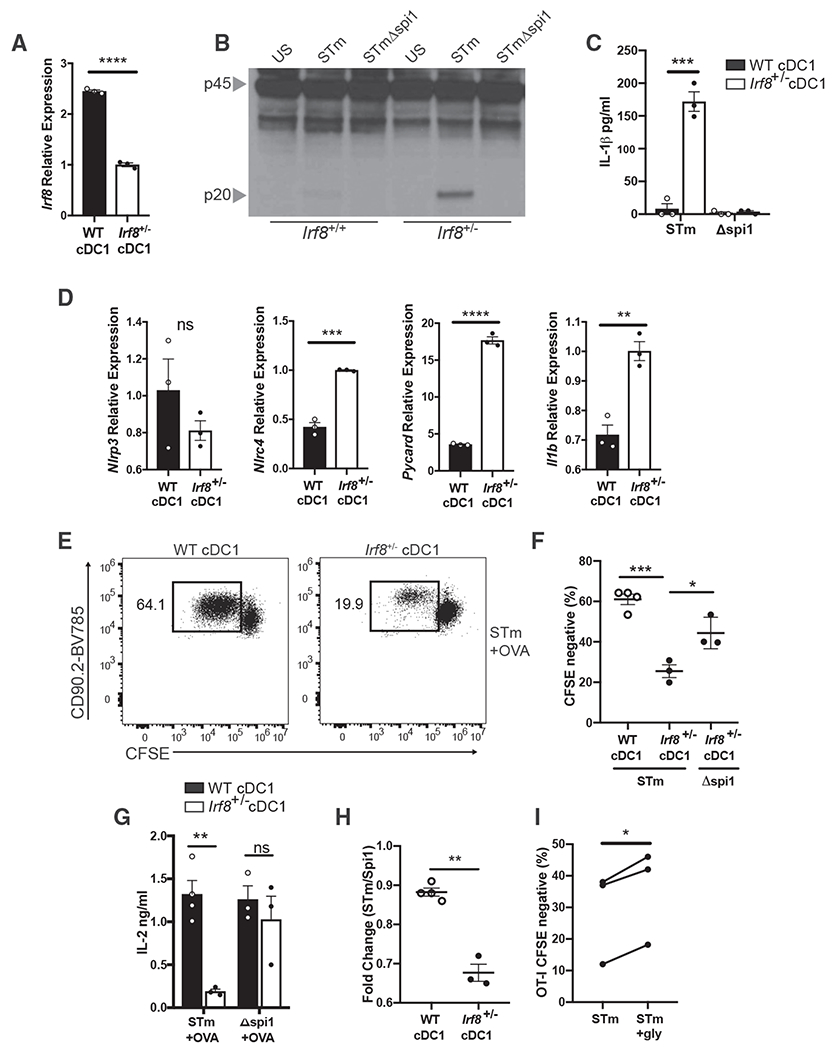
Figure 6. Irf8 Haploinsufficiency Restores Inflammasome Activation in cDC1s and Reduces Their Ability to Prime CD8 T Cells in Response to a Virulent Pathogen.

(A) qPCR of Irf8 mRNA in the lysates of FACS-sorted WT and Irf8+/− splenic cDC1s.
(B) Immunoblot analysis of pro-casp1 (p45) and cleaved casp1 (p20) in the lysates of FACS-sorted WT and Irf8+/− splenic DCs following pulse with STm or STmΔspi1 for 1 h.
(C) IL-1β was measured by ELISA in the supernatants of WT and Irf8+/− cDC1s from (B).
(D) qPCR of designated mRNA in the lysates of WT and Irf8+/− cDC1s following 4 h of LPS stimulation.
(E and F) (E) Representative data for flow cytometry of OT-I T cell proliferation and (F) quantification following 72 h of culture with FACS-sorted WT or Irf8+/− cDC1s that were pulsed with STm or STmΔspi1 and OVA.
(G) IL-2 was measured by ELISA in the supernatants of the cultures from (E).
(H) Fold change of OT-I proliferation was calculated from cDC1s of the same genotype pulsed with STm compared with STmΔspi1.
(I) OT-I T cell proliferation was quantified by flow cytometry following 72 h of culture with Irf8+/− cDC1s that were pulsed with STm and OVA in the presence or absence of 5 mM glycine.
Error bars indicate SEM; (A, C, D, and F–I) paired t test; (B and E) data representative of two independent experiments. *p<0.05, **p<0.01, ***p<0.001, ****p<0.0001; ns, not significant.
