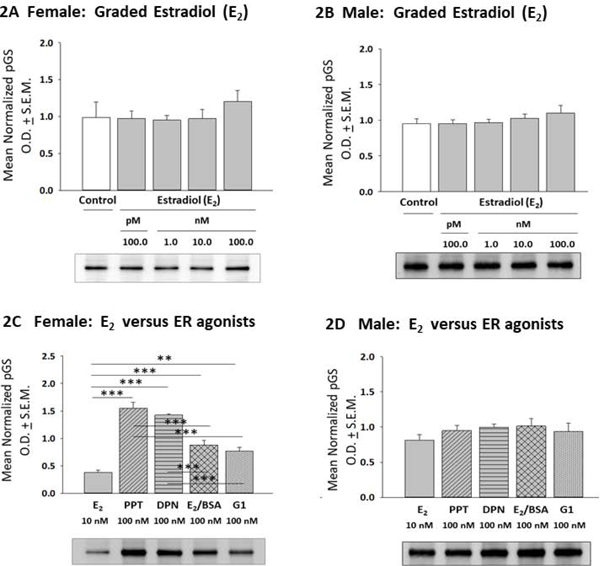
Figure 2:

E2 versus ER Agonist Regulation of Phospho-GS (pGS) Expression in Female or Male Hypothalamic Astrocytes. Data depict mean normalized pGS protein O.D. measures ± S.E.M. for female [Panel 2A; p = 0.56] or male [Panel 2B; p = 0.5106] astrocytes exposed to graded E2 dosages. Panels 2C and 2D correspondingly show E2 versus ER agonist effects on female [p < 0.0001] or male [p = 0.6641] astrocyte pGS content. **p < 0.01; ***p < 0.001.
