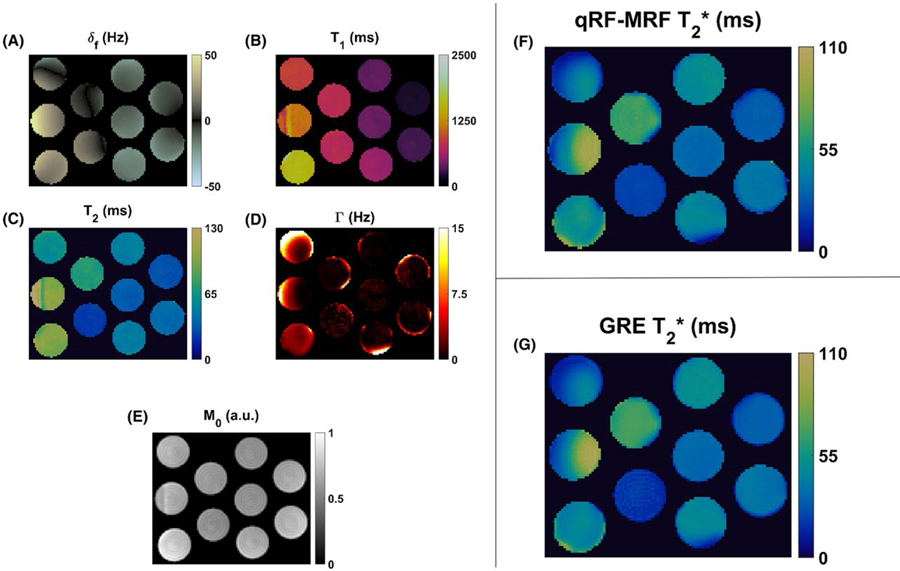
FIGURE 4.
Values of δf (A), T1 (B), T2 (C), Γ (D), and relative M0 (E) are shown for phantom with varied concentrations of gadopentate dimeglumine and agarose generated using qRF-MRF. The resulting qRF-MRF T2* map (F) shown was derived from T2 and Γ maps using Eq. (7). The comparison multi-echo gradient-echo (GRE) quantified T2* map (G) is also shown

