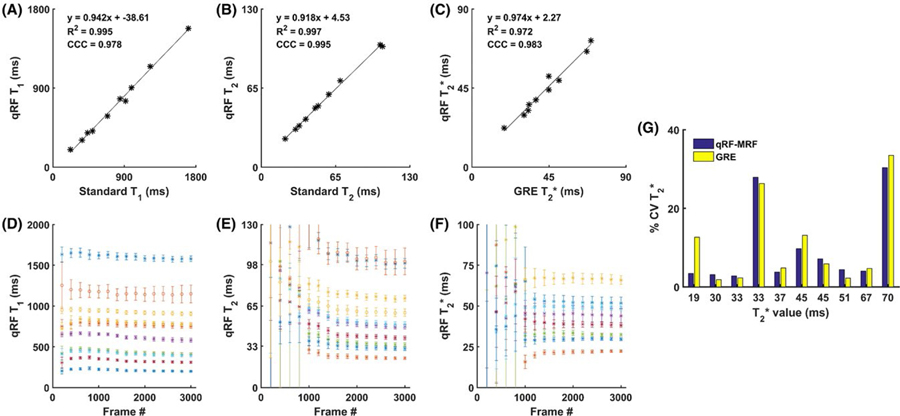
FIGURE 6.
Accuracy and reproducibility of qRF-MRF. The values of T1 (A) and T2 (B) values were measured within each phantom compartment using qRF-MRF against spin-echo methods. The T2* (C) values were measured within each phantom compartment using qRF-MRF against the multi-echo GRE method. The mean and SD of T1 (D), T2 (E), and T2* (F) measured within each compartment are shown with increasing number of time frames used during the dictionary-matching process. G, Coefficient of variation given by the SD divided by the mean, for T2* measurement for both qRF-MRF and GRE methods against the GRE-measured mean T2* value. The 2 compartments with large CV variation caused by poor local field homogeneity were excluded from (F) and plotted using circle markers in (D) and (E). Abbreviations: CCC, concordance correlation coefficient; CV, coefficient of variation

