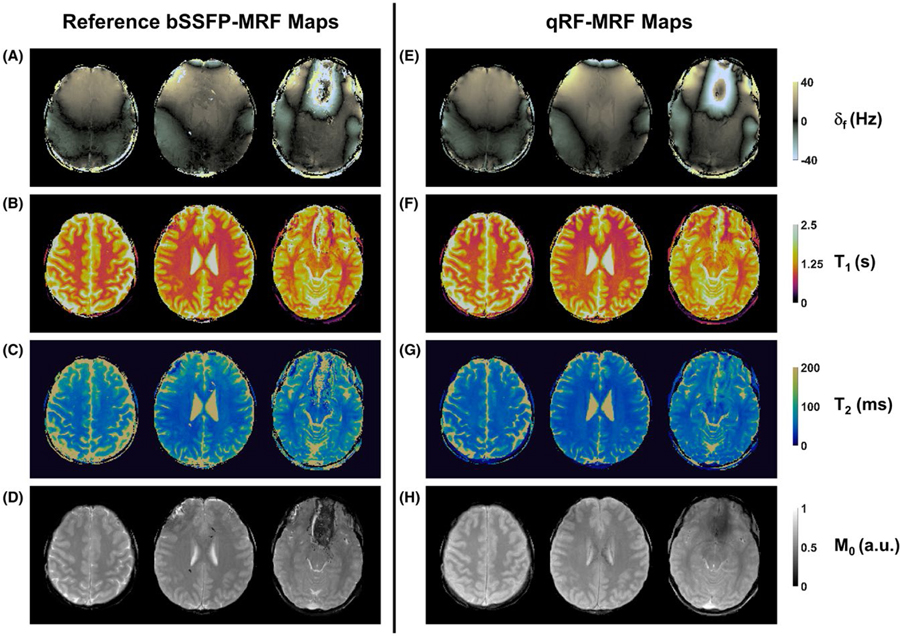
FIGURE 7.
Representative in vivo tissue property maps. Maps were acquired using both reference (left) and the qRF-MRF method (right) in healthy volunteers. Reference maps for δf (A), T1 (B), T2 (C), and relative M0 (D) were generated using the bSSFP-MRF method with the same number of time frames as the qRF-MRF method. The qRF-MRF method simultaneously generated δf (E), T1 (F), T2 (G), and relative M0 (H) maps are shown using the same scale as references maps. The total acquisition time for each scan was 38 seconds and 35 seconds per slice for each bSSFP-MRF and qRF-MRF scan, respectively

