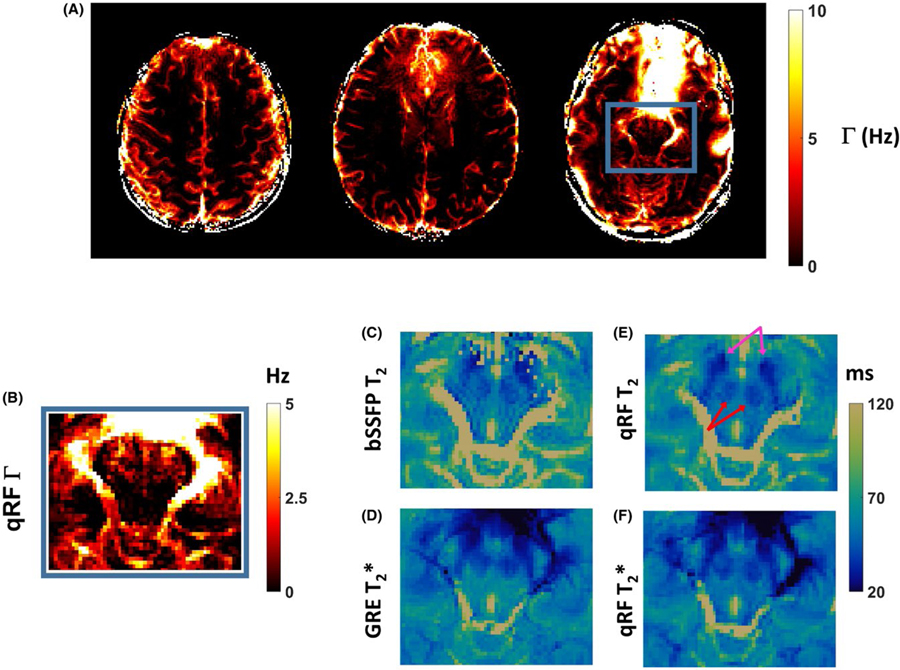
FIGURE 9.
A, The Γ maps acquired using the qRF-MRF method from the same experiments shown in Figures 7 and 8. B, Zoomed-in FOV of the Γ map to the midbrain structures. C,D, Corresponding zoomed maps from reference T2 (C) and T2* (D) maps. E-F, Corresponding zoomed maps from qRF-MRF-acquired T2 (E) and T2* (F) methods. The same scale and color map used for the T2 and T2* maps are shown. The lower T2 value associated with substantia nigra (pink arrows) and red nucleus (red arrows) can be observed across all methods for both T2 and T2* values

