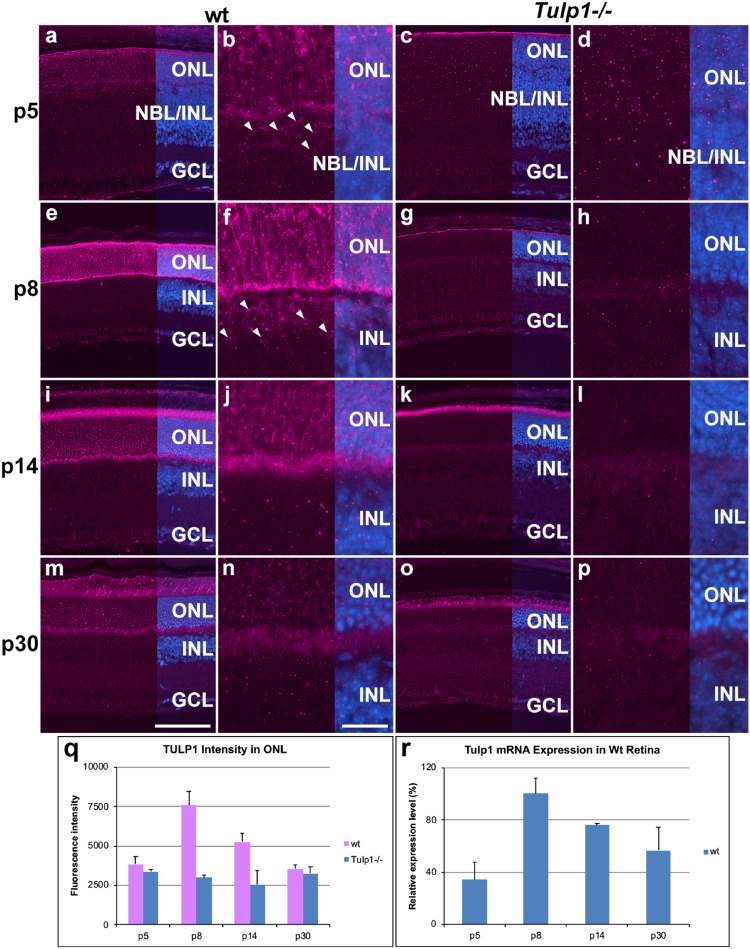
FIGURE 1.
TULP1 expression during postnatal development of the retina. Retinas from wt and Tulp1-/- mice were taken at p5, p8, p14, and p30 (n = 4). Sections were labeled with TULP1 (purple) immunocytochemistry and counterstained with DAPI (blue). (a,c,e,g,i,k,m,o) low magnification overview; (b,d,f,h,j,l,n,p) high magnification view of the ONL/INL boundary. Arrowheads indicate TULP1-positive cells in the NBL/INL (b) and INL (f). TULP1 label intensities were quantified in the outer nuclear layer (ONL; q) from microscope images using cellSens software and results are given in a bar chart; bars represent mean + SD (n = 4). (r) Tulp1 RTqPCR was carried out using Actb control for normalization; data are provided in a bar chart; bars represent mean + SD (n = 3). INL, inner nuclear layer, NBL, neuroblast layer; GCL, ganglion cell layer. Scale bar (m): 100 μm. Scale bar (n): 20 μm.

